Graph visualisation is providing insights for policy-makers and implementers
In our last blogpost in this series, we showcased our new graph visualisation tool, which enables investigators to better understand the complex ownership networks and the sphere of influence of beneficial owners. In this blog, we’ll explore how graph visualisation benefits another, perhaps less obvious, set of users: policy-makers and implementers.
Open Ownership sits in a unique position at the intersection between policy and tech. At its core, our theory of change is built on working with beneficial ownership data ourselves, and understanding the requirements of our end users. In turn, this informs our policy recommendations, helping to ensure we create beneficial ownership data that is useful, usable and understandable. Building our graph visualisation tool was a prime example of putting this approach to work – it forced us to think beyond obvious implementation provisions and towards use and best practice.
Our research found that many key stakeholders interacting with governments and decision-makers didn’t use visualisation when making their case. As visualisation can be an extremely powerful way to tell stories, we wanted to ensure this feature was useful for policy makers showing the importance of ownership disclosure and open data. In the process, we uncovered a number of important insights and questions, which we explore in this blog.
With our user centred approach in mind, we wanted to use graph visualisation to understand what good policy and implementation of beneficial ownership disclosure looks like. This meant asking two questions:
- Can users complete investigations successfully and rapidly?
- Can they do so straight from the open data, or is a costly transformation required to make that data truly useable?
Comparing data collection models
One insight our graph visualisation surfaced - and in a very visually striking manner - was a comparison of national data collection models. At a macro level, there are currently two models of data collection currently live in the world. These are:
a) Asking companies to provide the next level up of legal ownership, whether that ownership is corporate or individual;
and / or
b) Asking companies to only provide their ultimate beneficial owners (UBOs), which must correspond to actual people.
The Open Ownership Register currently aggregates data from registers that employ both these models. Here’s what we learned about the two approaches while building our visualisation tool, using the UK and Danish registers as examples.
The UK
In the UK, the Persons of Significant Control regime allows companies to declare another company as an equivalent of their beneficial owner (known as a Relevant Legal Entity, or RLE) under specific conditions. The advantage of this approach is that companies are declaring either their Ultimate Beneficial Owners (UBO), and/or the next level of corporate ownership, allowing you to piece together the chain. In theory, this allows us to gain visibility of the full ownership network, instead of intermediate corporate entities being hidden away in black box data, which can happen when only the UBO is provided. In practice, RLE conditions are not being enforced, so we still see gaps in the data.
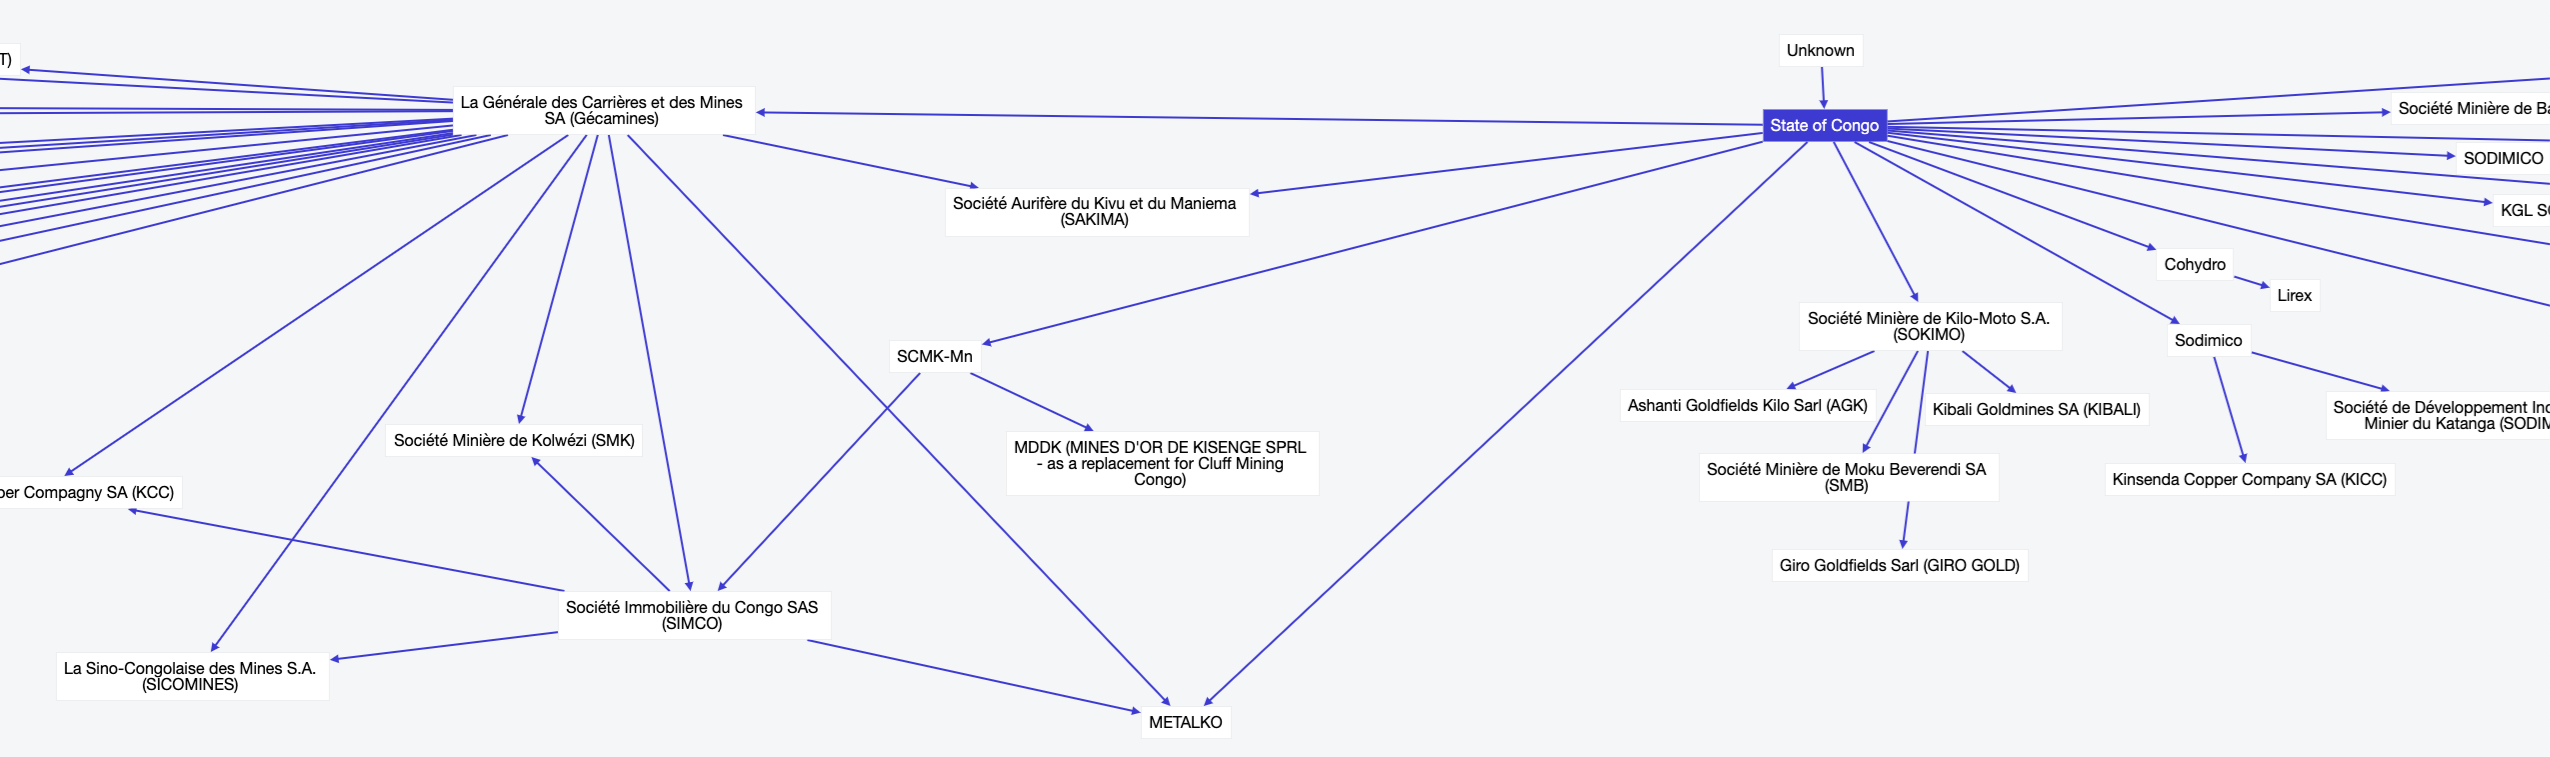
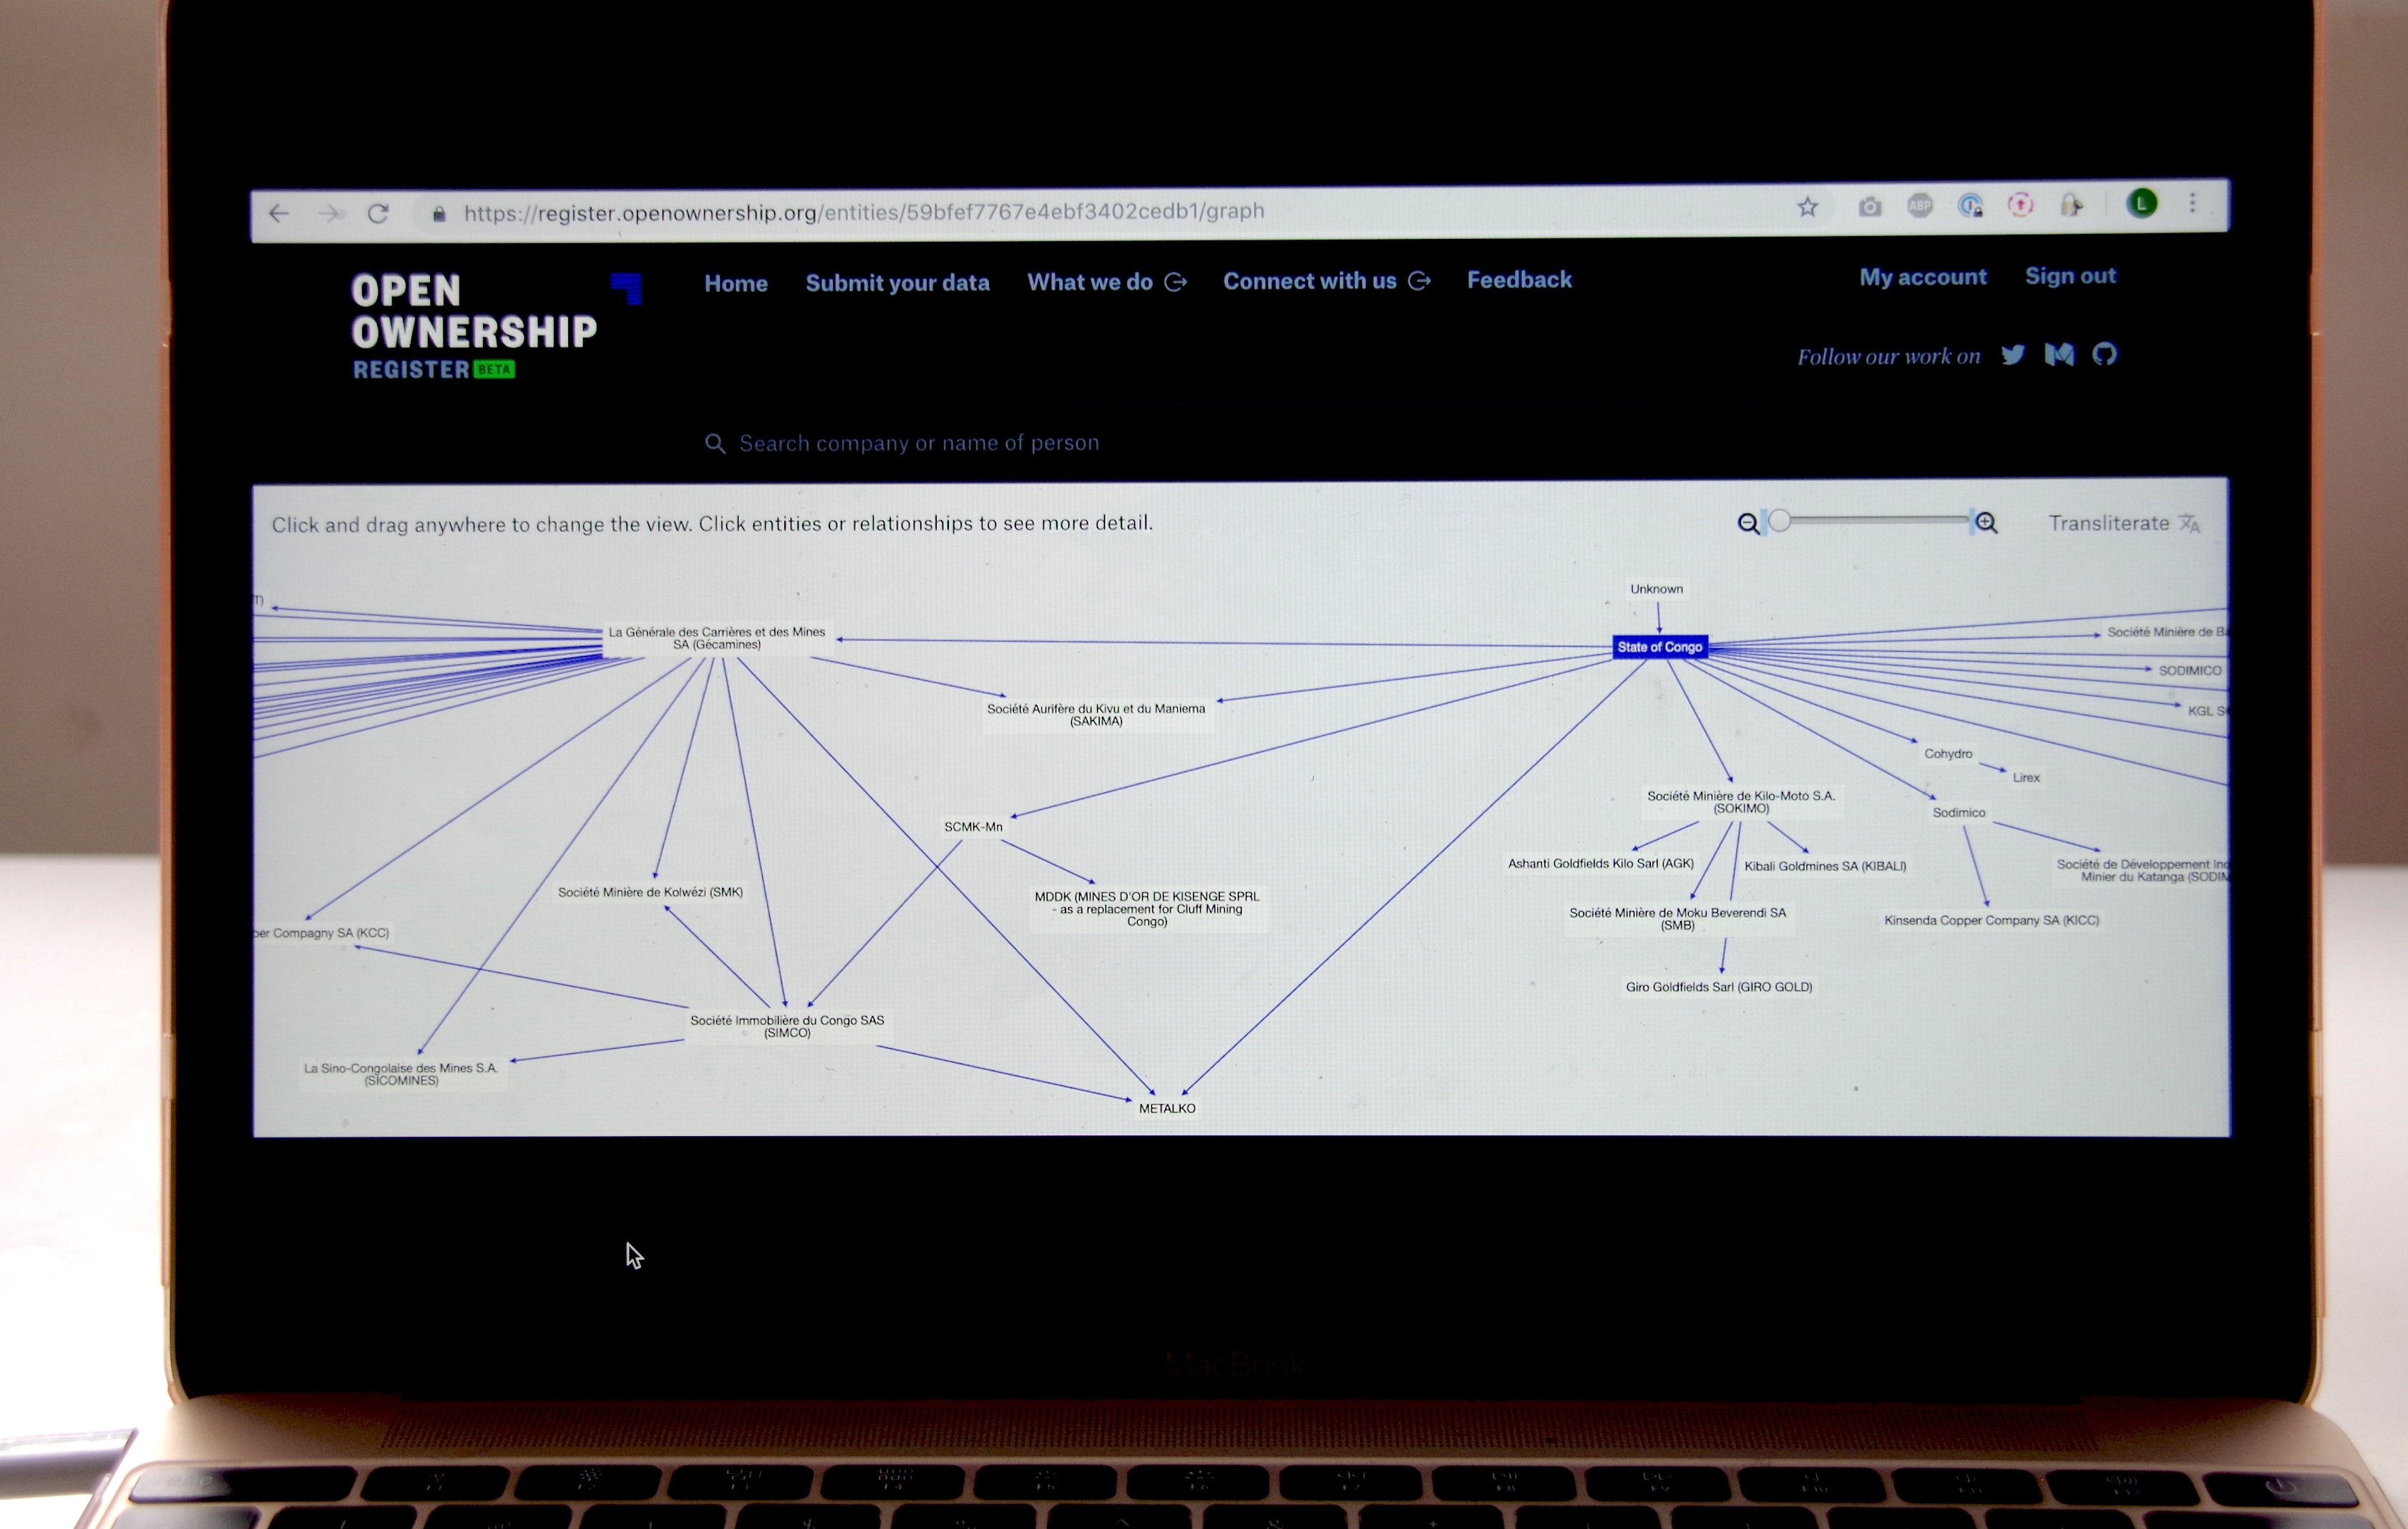
This approach of capturing intermediary corporate ownership is not unique to the UK. When EITI shared data collated from the extractive industries between 2015 and 2017, some countries such as the Democratic Republic of Congo provided indirect ownership by default. This allowed analysts to get a very quick sense of the hierarchies and shape of the local extractive market as a whole, rather than direct relationships alone.
Denmark
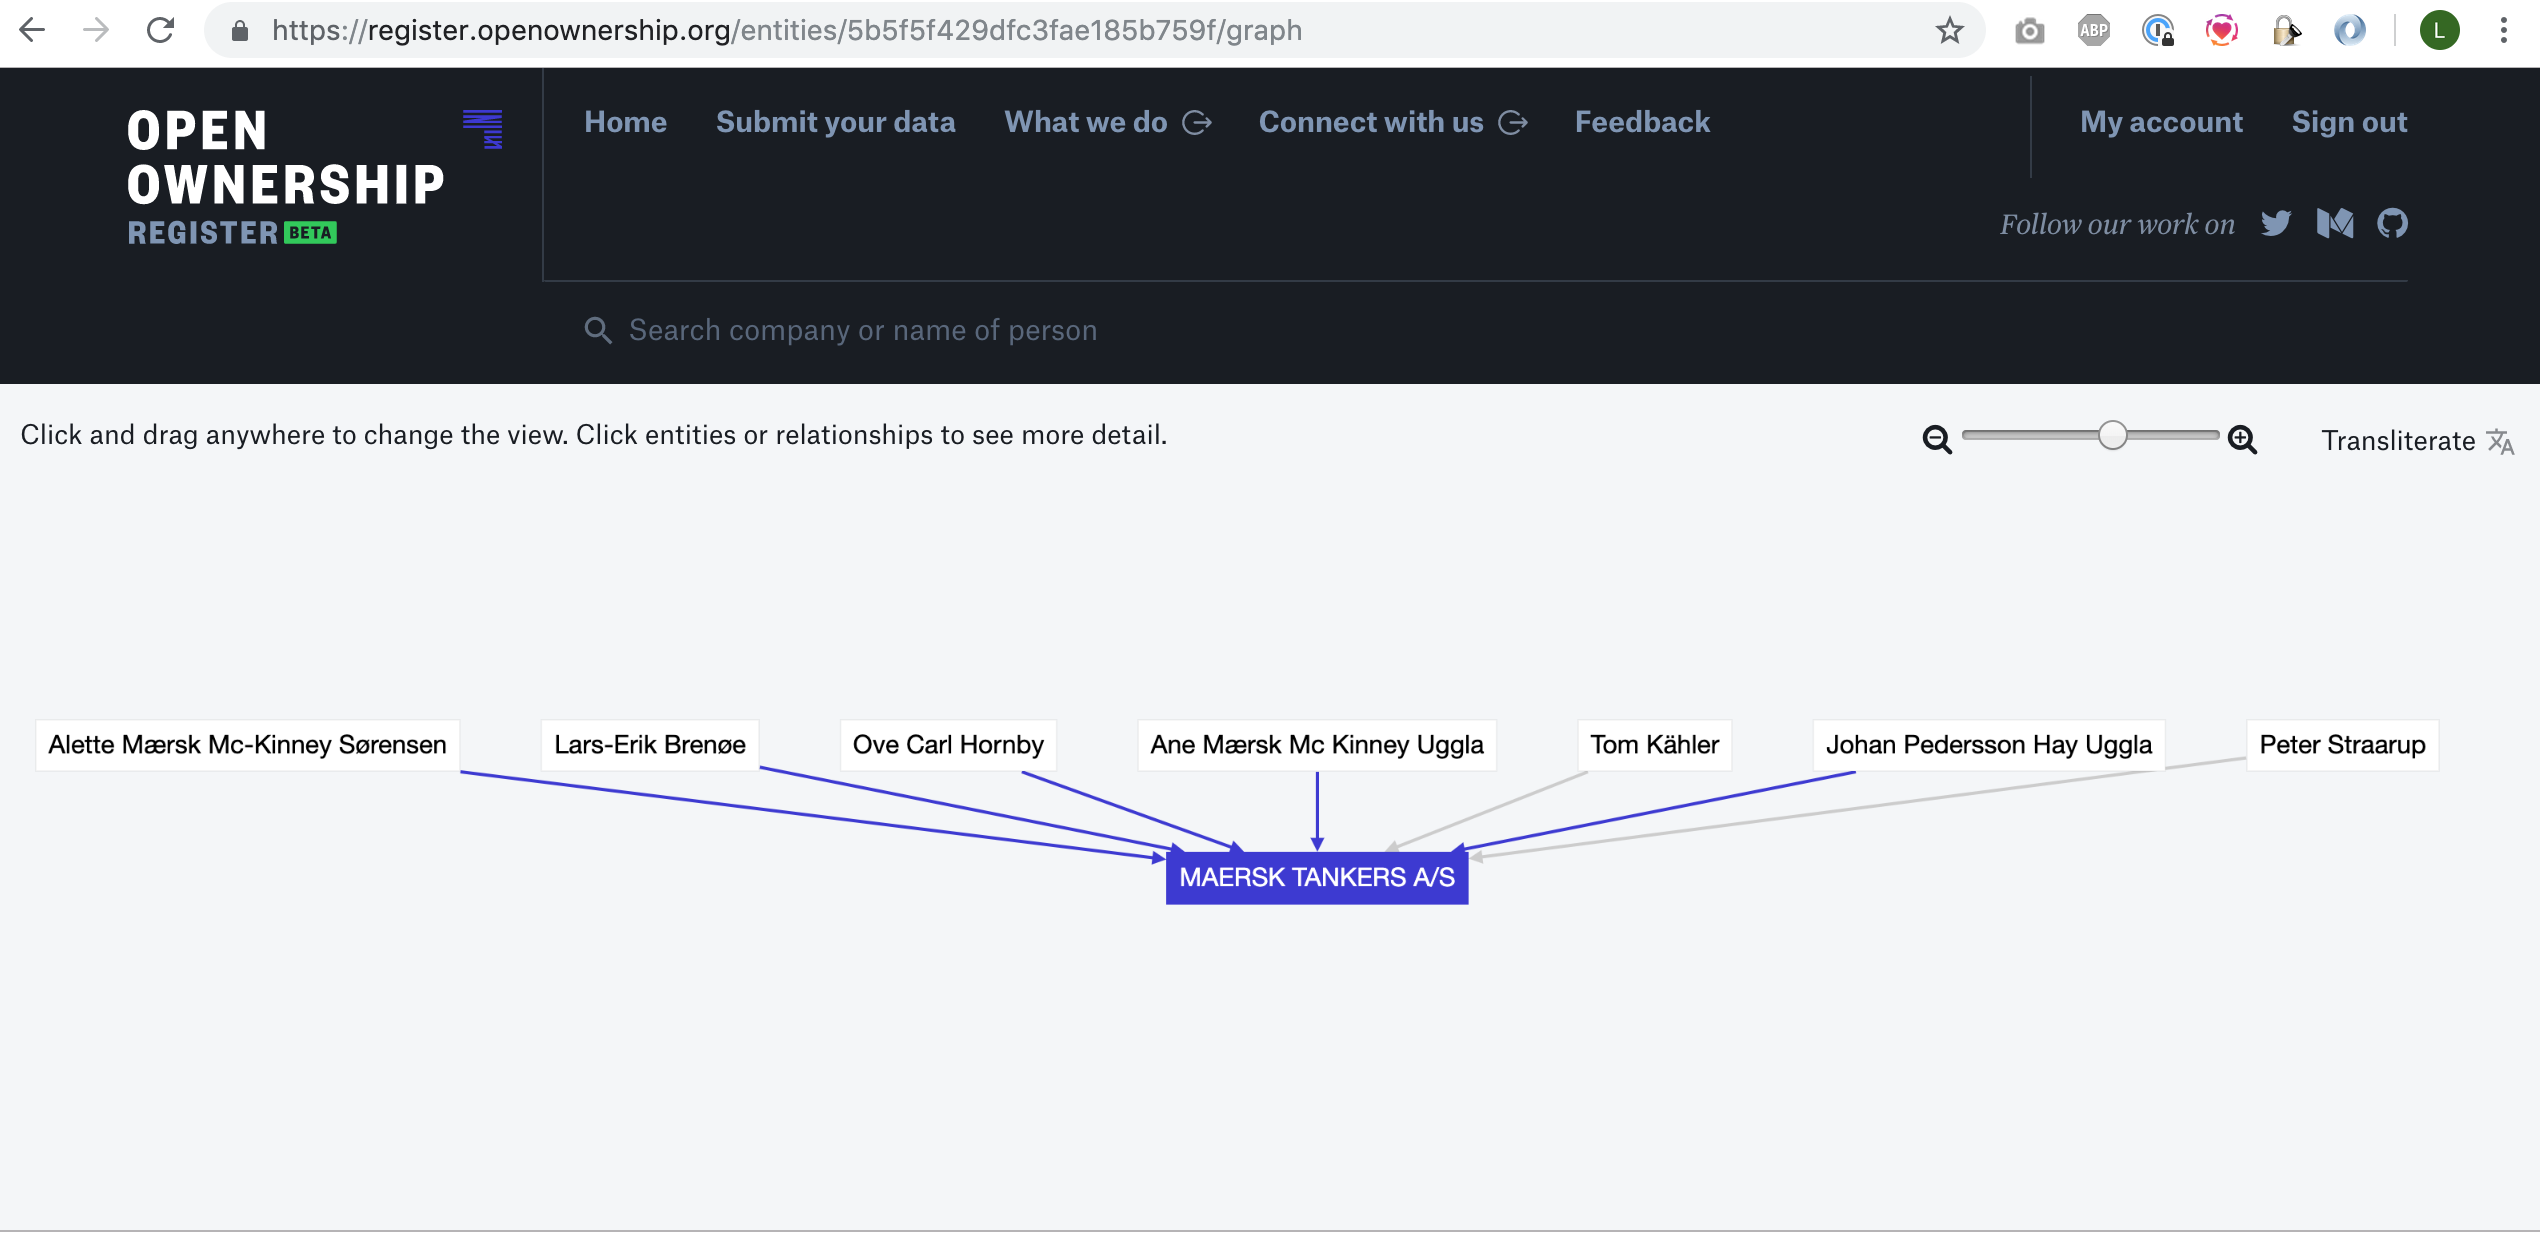
In contrast, the Denmark Central Business Register (CVR) clearly separates the concepts of legal (or corporate) ownership and beneficial (or human) ownership. This arguably works closer to the AMLD4 definition of beneficial owner as “any natural person who exercises ownership or control over a legal entity”. It’s also very effective: the Danish legislation doesn’t offer any escape route from declaring who the people behind the companies are, and ownership trees tend to be complete (this makes for pretty boring graphs).
The Danish register doesn’t purposely withhold intermediary corporate ownership; it simply draws a very clear separation of concerns between legal ownership (legale ejere) and beneficial ownership (reelle ejere). The concepts are separate in the data and code, so it is possible to pull one without the other, or both together if we so wish. Separating these forms of ownership is undoubtedly a cleaner and more elegant approach, but with the drawback that more developer time and effort is required to present the full picture. In order to capture a fuller picture of hierarchies in the data, ingesting Danish ‘legal ownership’ data is currently under consideration in our roadmap.
Implementing an International Standard
As all complex ownership networks are multinational, another checkpoint for evaluating the data collection models is how these national models interact in practice. The Open Ownership graph visualisation tool is able to walk through ownership relationships regardless of the provenance of the data, connecting nodes and linking entities across multiple jurisdictions. This allows users to benefit from the most transparent regime, which in turn can be a powerful advocacy tool.
For this approach to work, however, beneficial ownership data has to be available as open data, and aggregated in a standardised, machine-readable format. OpenOwnership has been trialling a solutions to this; our Beneficial Ownership Data Standard (BODS) – but that’s a matter for another blog post.
Findings
The Open Ownership graph visualisation tool can be an incredibly powerful storytelling device, enabling policy makers to understand and explain the complexity of international corporate networks. It also illustrates in a very visual way the pros and cons of different beneficial ownership data collection models.
Finally, graph visualisation highlights the importance of publishing beneficial ownership registers as high quality open data, which is critical to widening access. Accessibility is essential to gain insights into good policies and support their ultimate purpose: making it effortless to find out who ultimately owns and controls a company, thus supporting good governance and healthy democracies.