A second look at “Structured and interoperable beneficial ownership data”

Two: reduced costs
This is the second post in a series which looks at Open Ownership (OO)’s new Structured and Interoperable Beneficial Ownership Data briefing.
Our last blog post covered improved functionality: in summary, structured data is predictable. This makes data clear and easy for many more people to use and analyse, and facilitates collaboration across different organisations and jurisdictions.
Today we will cover the second benefit: the cost savings that can accrue to countries who collect, store and publish their data as structured data. We’ll show how the savings run right through the life cycle of information gathering, and include its maintenance, use and impact.
Reduction in costs
The decision to structure BO data generally involves a higher upfront cost, but this is paid off over time through lower operational costs. Structuring data requires work, and resolution of ambiguity upfront. As a simple example, stating that date fields should follow a specific format: when we know that ISO 8601 is used (YYYY-MM-DD), we know that 2022-07-11 is 11 July 2022, rather than 7 November 2022. Imagine the savings even the eradication of that confusion can cause.
The interoperability of data sets is also crucial to a reduction in cost. Data is interoperable when it can be readily used with other sources of data, and integrated into different systems and processes. Interoperable BO data, for example, might use a widely-agreed method for describing company numbers, allowing datasets from multiple jurisdictions to be joined together. An example of how interoperability reduces cost is that it allows tools and analysis built in one context to be reused in another, reducing costs and development times.
Secondly, the bulk of artificial intelligence effort in corporate data is currently spent on disambiguating data. High levels of interoperability allows resources which would otherwise be spent on cleaning data to be spent on analysing it.
There are several ways that structured and interoperable data reduce costs through its life cycle:
- Savings in publishing, maintaining and upgrading BO data;
- Savings in the cost of the public and private sector to use BO data;
- Savings in achieving wider governmental policy aims, like reducing tax evasion, because the data is interoperable and so data and tools built in one context can be used in another; and
- Savings in producing data, both when companies submit declarations, through standardised forms, and when a country publishes it, in a central register.
Examples of savings in each case
1. Savings in publishing, maintaining and upgrading BO data: In Slovakia the development of a new register cost c. EUR330,000, and yearly operating costs are estimated to be EUR33,000. To contextualise these costs, a post-implementation valuation of user benefits in the UK concludes that, in aggregate, the annual user benefits of BO data are estimated to be between £40-120 million per year.
2. Savings in the cost of the public and private sector to use BO data: Where structured BO data is available, this can be readily integrated into, for example, in-house or outsourced onboarding, due diligence, or regulatory technology services. In research conducted by OO on the use of BO data by financial institutions, one bank estimated the cost of handling unstructured BO reports in PDF form for customer due diligence to be “an extra EUR 7 per review” in comparison to a jurisdiction that makes its BO information available as open, structured data. This is a big cost for a bank which conducts thousands, even tens of thousands of reviews per year. The cost for law enforcement to access unstructured information was noted as a significant motivation behind increasing BOT in Canada.
3. Savings in achieving wider governmental policy aims: When data is structured, it provides a common language that enables different systems to speak together and reduce the costs of achieving policy aims. Tools and analysis built in one context to be reused in another, reducing costs and development times. For example, BO data can be easily linked between jurisdictions to give a more complete view of transnational ownership structures. With unstructured data that is not readily interoperable, this would be an extremely arduous, time and resource consuming – if not outright impossible – task. OpenSanctions is an international database combining information on individuals and legal entities from multiple sources – including national BO registers – and linking this to sanctions and politically exposed persons lists.
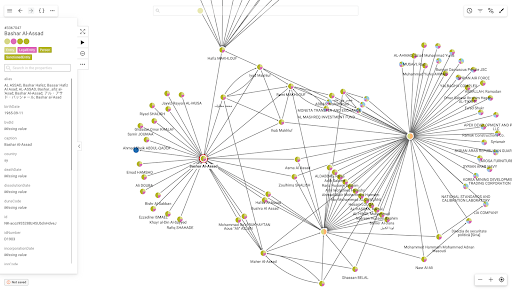
Figure 1: OpenSanctions mapped BO data from the Offshore Leaks database published by the International Consortium of Investigative Journalists to the FollowTheMoney data model used by OpenSanctions and the Organised Crime and Corruption Reporting Project. This data is then combined with OpenSanctions’ own database, loaded into a Neo4J graph database, and uploaded to a data visualisation platform provided by Linkurious so that people can explore and visualise the connections between sanctioned or politically exposed people and leaked BO data using open data.
4. Savings in producing data for companies and governments: For its pilot BO register in 2020, Armenia initially collected information via paper forms, whilst it was finalising the upgrades to its register software. These paper forms were then converted into PDF format and published online. Though this permitted some analysis of the disclosures, the absence of structured data limited its utility, and made carrying out any checks significantly labour-intensive.
By September 2021, Armenia had incorporated the Beneficial Ownership Data Standard (BODS) into the design of its register software. It also deployed the BODS visualisation library to generate graphical representations of ownership structures and this has been incorporated into both the public register as well as the submission of BO declarations. As company ownership structures are more easily understood in graphical format, these visualisations have helped lower the chance of inaccurate data submissions and reduce, in turn, the resources required from the state register to check and process declarations. Additionally, because the data is structured, Armenia is now in a better position to replace resource-intensive manual checks with lower-cost automated checks on the forms to ensure they are eligible for submission.
In this post, we have explained four ways that structured BO data can save money over the long-term, and in the first blog post in this series we covered all the ways it improves functionality. Next time, in the last in this series, we will focus on the greater policy impact it enables. BO information is rarely used in isolation, and it is often at its most valuable when it is combined with other datasets.
Related publications

Publication type
Blog post
Topics
Beneficial Ownership Data Standard
Sections
Implementation,
Research,
Technology
Open Ownership Principles
Structured data