Exploring patterns of beneficial ownership reform
In March 2023, I wrote about how different areas of global governance can teach us about the adoption of beneficial ownership (BO) policies worldwide. I described international and domestic factors which might contribute to a government’s decision about whether to introduce BO legislation, and to its commitment to implementing new laws effectively. Since then, I have analysed the Company Information module of the Global Data Barometer’s 2021 dataset to explore whether those factors appear in patterns of beneficial ownership transparency (BOT) reforms across the world.
It can take many years to build political support for BOT reforms and to deliver the necessary legislation, processes, and technology. For example, Elizabeth Meehan’s study of BOT reforms in advanced industrial democracies describes a policymaking process in which early interventions by civil society actors leads over time to supportive lobbying from parts of the private sector. A snapshot comparing countries across the world in a single year (2021 for the Global Data Barometer) will never be able to capture the complexity of those efforts.
Nonetheless, an exploratory quantitative approach can describe overall patterns of BOT reform and suggest factors for deeper investigation in individual case studies. This blog post summarises the results of my analysis and highlights, for example, how levels of corruption, democracy, government effectiveness, and previous experience of being greylisted by the Financial Action Task Force (FATF) are all associated with different levels of BOT reform. The next stage of my research will involve in-depth qualitative research of BOT reform in Indonesia and South Africa to develop a more precise theory of change.
If you would like to read the full working paper, which details my methodology and data selection, preparation, and analysis, please contact me at [email protected]. From 9:30 UTC on Wednesday 21 February, I will present this paper at the Symposium on Systems of Financial Secrecy, hosted by the London School of Economics and Open Ownership. The event is open to the public, with a really interesting line-up of speakers. It would be great to see you there (register to attend online).
Measuring beneficial ownership policy adoption across the world
The Global Data Barometer’s Company Information module was developed in partnership with Open Ownership. Countries were assigned scores according to a consistent methodology for four indicators: governance of BO data; availability of BO data; availability of corporate registry data; and use of corporate due diligence data. My analysis principally used the aggregate Company Information score to measure a country’s level of BOT reforms, in which a high score implies better governance and higher availability of beneficial ownership information (BOI) and corporate registry data. I then repeated the analysis using the BO indicators specifically.
This data has two limitations for my analysis. First, it only covers 67 of the 110 countries in the scope. Second, it includes the publication of BOI as part of effective implementation, which is a live debate. I addressed these by carrying out robustness checks: for example, by demonstrating that the countries with data did not differ significantly on the independent variables compared to the missing data countries, and by repeating the results with FATF Mutual Evaluation data.
I began by producing descriptive statistics about the variation in BOT reforms, separating countries into four groups. First, there are G7 countries, which previously tolerated the abuse of anonymous corporate ownership but which have recently passed important domestic BOT legislation, such as the United States (US) government’s Corporate Transparency Act and the United Kingdom government’s Economic Crime and Corporate Transparency Act, and advocated for BOT reforms in international forums, such as the United Nations Convention Against Corruption.
Second, there are European Union (EU) member countries, which have a legal duty under the 4th Anti-Money Laundering Directive (AMLD4) to establish a central BO registry. This does not mean that implementation is straightforward; EU governments have moved at different speeds to implement AMLD4, and there are ongoing legal and policy debates about public access to BO data and privacy rights. Nonetheless, EU member states and those aligned with EU law face a substantively different strategic decision due to their legal duties.
Third, there are offshore financial centres, which have economies that are centred around highly professionalised financial, accountancy, and legal services. These countries are interesting because their professional service firms (and therefore large parts of their economies) typically rely on both the ability to use opaque corporate structures and the country’s reputation for sound governance.
Fourth, there is the large group of countries outside those previous categories, which have not played a leading role in creating the offshore economy and which face no legal obligation to bring in BO reforms, but which still face pressure from FATF Mutual Evaluations and the associated lists of “Jurisdictions under Increased Monitoring” and “High-Risk Jurisdictions subject to a Call for Action” (often referred to as grey and black lists). These governments, like others, may also have strong domestic policy incentives to implement BOT reforms.
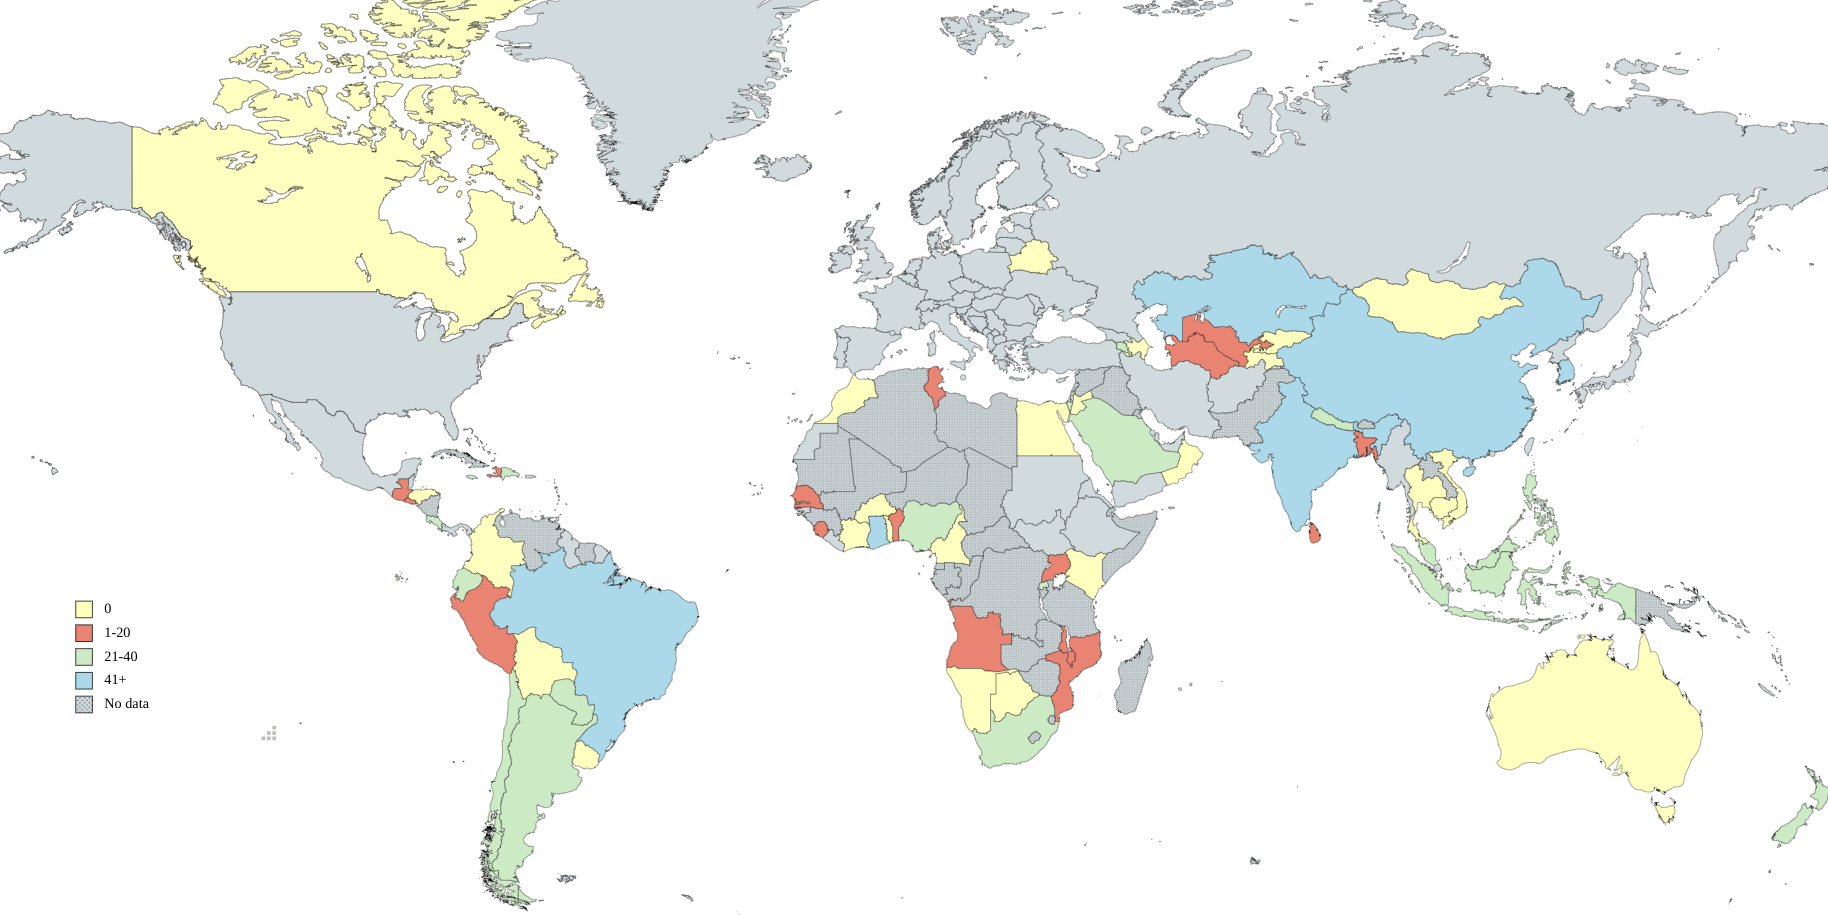
The majority of these countries are in the Global South; they were the principal focus of my analysis. Image 1 shows the distribution of scores on the Company Information dataset for the 67 in-scope countries I analysed with data from the Global Data Barometer. [1] My research question is: what factors can help explain the variation in BO policy implementation, measured using their Company Information scores, between those countries?
Image 1. Company information scores for the countries analysed
International factors: Experience of FATF greylisting may incentivise BOT reforms
The principal source of international pressure on governments to introduce BO reforms is the FATF. Recommendations 24 and 25 of its 40 recommendations relate to BOT, for legal persons and legal arrangements respectively. The FATF and its associated regional bodies carry out peer reviews (Mutual Evaluations) of countries’ adherence to those recommendations, assigning scores of non-compliant, partially compliant, largely compliant, and compliant for each. Countries which are assessed as having significant deficiencies in their anti-money laundering regimes are added to the FATF grey list (or black list, but this does not apply to any of the 67 countries analysed here).
Being placed on the FATF grey list is costly. An International Monetary Fund study found that being greylisted results “in a large and statistically significant reduction in capital flows”, whilst another study found a reduction in the ratio of foreign direct investment (FDI) to GDP of 2% and a decrease of cross-border liabilities of 16%. I therefore tested whether the threat of greylisting made countries more likely to implement BOT reforms. First, I tested whether higher levels of net FDI per capita was associated with BOT reforms, as countries which received more external investment may be particularly concerned about their reputation for good governance. Second, I tested whether past experience of being greylisted was associated with BOT reforms. Table 1 shows the results.
Table 1. Correlations between BOT reforms and exposure to FATF pressure
| Independent variable | Integration with the global economy | Experience of FATF pressure | Experience of FATF pressure |
| Measure | Net FDI per capita, across a five-year average (World Bank 2019) | FATF greylisting from 2000 to 2019 | FATF greylisting from 2009 to 2019 |
| Correlation with Company Information score | -0.117 | 0.051 | 0.164 |
| Statistical significance at 10% | No | No | Yes |
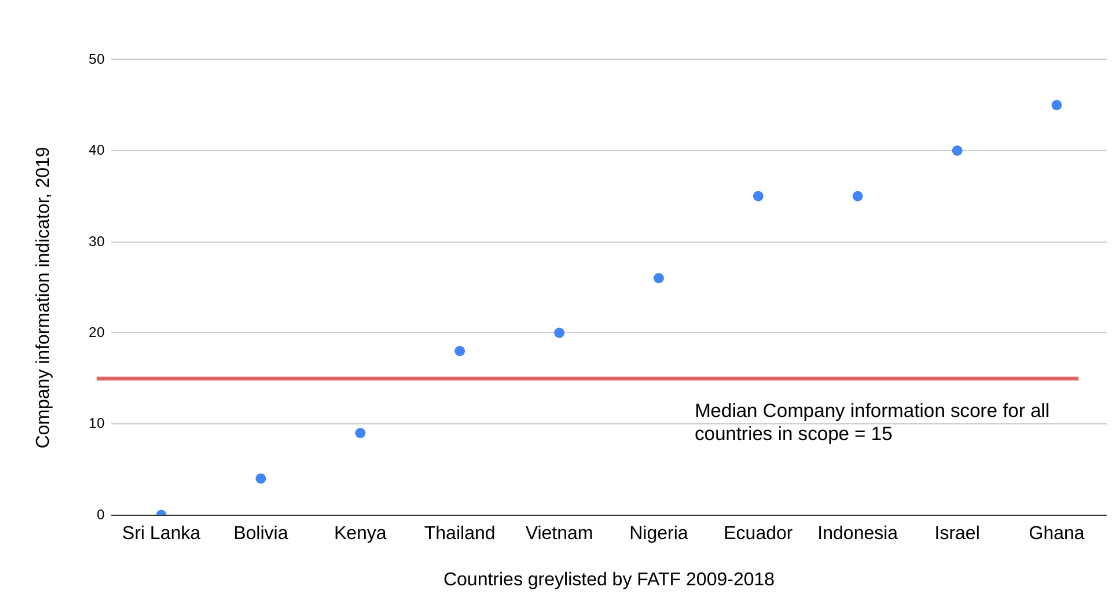
The weak correlation between FDI and BOT reform does not support the hypothesis that variation in vulnerability to FATF Mutual Evaluations affects BOT reforms, although this is worth further investigation in case of measurement error or missing variable bias. The positive correlation of FATF greylisting, with recent experience seemingly counting more, is interesting; this group of countries were among the worst under-performers in previous FATF reviews but have since over-performed in implementing BOT reforms. This reflects recent anecdotal evidence of countries introducing BOT reforms with explicit reference to FATF greylisting, such as South Africa and the Philippines. Graph 1 illustrates this over-performance in comparison to the average of countries included in my analysis, as measured by the Global Data Barometer.
Graph 1. Countries with recent experience of FATF greylisting were subsequently more likely than average to implement BOT reforms
Domestic political economy: More democratic countries are more likely to implement beneficial ownership transparency reforms
Previous studies of public policy development have found that democratic participation, electoral democracy, and low levels of political corruption are all associated with governance reforms. Whilst causal processes vary in their detail, a common feature is that government systems which are participatory and democratic are more likely to prioritise public benefits over narrow private interests. This seems intuitively important in the case of BOT reforms, in which a small set of actors receive outsized benefits from corporate opacity at cost to the broader public. I therefore tested the association between a range of governance variables with the Company Information dataset. Table 2 shows the results.
Table 2. Correlations between BOT reforms and domestic political economy
| Independent variable | Democratic participation | Electoral democracy | Electoral democracy | Political stability | Civil society strength | Civil society strength |
| Measure | (V-Dem 2019) | (V-Dem 2019) | (Freedom House 2019) | (World Bank 2021) | (V-Dem 2019) | (World Bank 2019) |
| Correlation with Company Information score | 0.224 | 0.225 | 0.253 | 0.163 | 0.164 | 0.250 |
| Statistical significance at 10% | Yes | Yes | Yes | Yes | Yes | Yes |
The positive correlations are all consistent with the hypothesis that open, participatory and stable government makes BOT reforms more likely. These variables all correlate with other potential explanatory variables, meaning that there may be omitted variable bias. Whilst this is impossible to exclude given the limited sample size, the correlations remain positive when controlling for GDP per capita, and the exploratory regression analysis described below suggests that the government system has an independent impact on the likelihood of BOT reforms.
The effects of domestic policy impact on BOT reforms appear to be conditional on the level of democratic participation
Governments may also be motivated by domestic policy goals when they implement BOT reforms. The IMF’s Guide to Beneficial Ownership Transparency describes four principal domestic applications of BO policy: anti-corruption, natural resource management, preventing tax evasion, and national security. Whilst national security was an important argument in securing bipartisan support for the US government’s Corporate Transparency Act, it has been less important in other contexts and is difficult to operationalise as a single variable due to the variety of national security applications of BOT reforms. My analysis therefore focused on the former three, which have often appeared as salient policy issues in case studies of BOT reform.
Past experience of governance reform suggests that high domestic policy impact from reform often coincides with entrenched private interests having more to lose. In those cases, the balance of power between the two may be critical in determining the likelihood of reforms succeeding and enduring. Table 3 shows how this interaction can be conceptualised.
Table 3. Proposed interaction of domestic policy impact and political economy
| Low domestic policy impact of BO reforms | High domestic policy impact of BO reforms | |
| Entrenched private interests control national government | BO reforms less likely to be implemented | BO reforms highly unlikely to be implemented |
| Public interests control national government | BO reforms more likely to be implemented | BO reforms highly likely to be implemented |
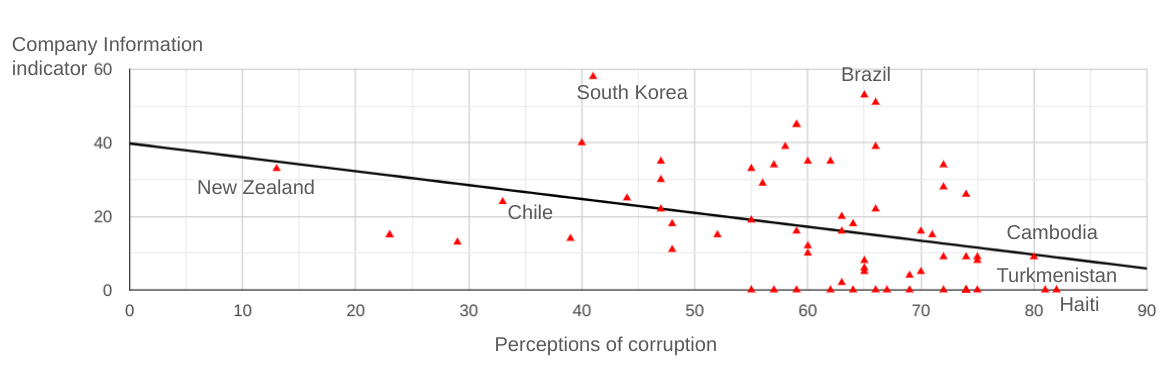
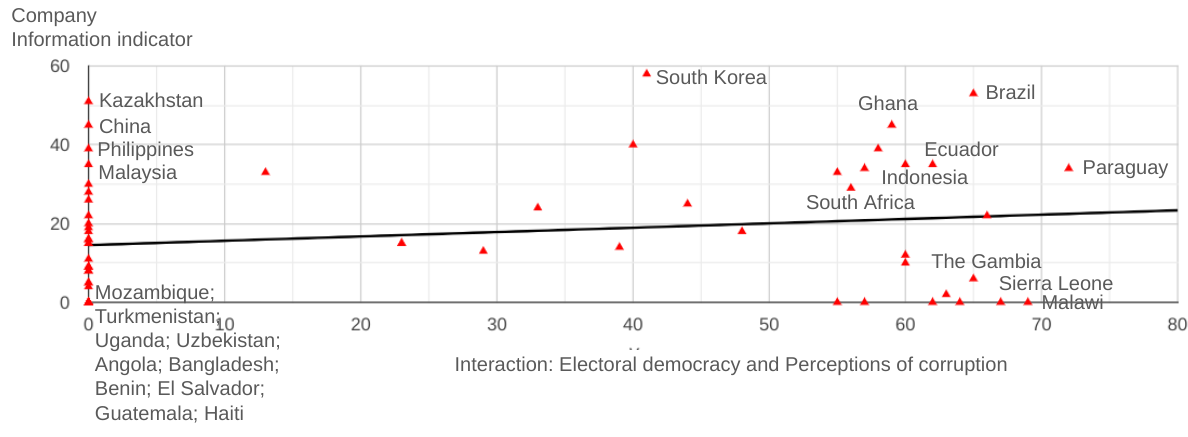
As Table 4 shows, perceived corruption and tax evasion risk both have a negative association with BOT reforms, including when controlling for GDP per capita, whilst natural resource management indicators have no significant correlation. However, these effects reverse when the variables are made conditional on the country being an electoral democracy (as measured by Freedom House). Graphs 2 and 3 show how corruption has a negative relationship with BOT reforms, but when corruption score interacts with a binary democracy variable, the effect reverses. In other words, countries which have high levels of both democracy and corruption are especially likely to implement BOT reforms.
Table 4. Correlations between BOT reforms and domestic policy goals
| Independent variable | Policy incentive to reduce corruption | Policy incentive to address tax evasion | Policy incentive to govern natural resources | Policy incentive to govern natural resources |
| Measure | Corruption Perceptions Index 2019 [2] | Estimated loss from tax evasion per capita (Tax Justice Network 2021) | Extractive industry dependency (IMF 2012) | Membership of the Extractive Industries Transparency Initiative |
| Correlation with Company Information score | -0.350 | -0.254 | -0.037 | -0.052 |
| Statistical significance at 10% | Yes | Yes | No | No |
Graph 2. The negative relationship between BOT reforms and corruption levels
Graph 3. The positive relationship between BOT reforms and democratic countries with higher levels of corruption
Government capacity also matters
BO reforms are not straightforward to implement. They require legal powers for the collection of BO data; technical systems to facilitate the collection, verification, storage, and publication of BO data; and analytical skills in government agencies, media, and civil society to make use of it. Previously, Nkechikwu Valerie Azinge-Egbiri found that both civil service and legal capacity affected the extent to which African countries implemented the FATF’s anti-money laundering standards.
As Table 5 shows, government and legal effectiveness have positive relationships with BOT reforms, whilst also controlling for GDP per capita. Furthermore, it suggests that governments’ technological capacity matters in particular, bolstering the case for external technological support for BOT reforms.
Intuitively, the size of the informal economy may also affect a government’s ability to implement BO reforms, as high numbers of unregistered companies may undermine efforts to establish a robust system of corporate transparency. However, there was no statistical relationship between the size of a country’s informal economy and its Company Information score.
Table 5. Correlations between BOT reforms and government capacity
| Government effectiveness | Government effectiveness – technology | Legal framework | Legal framework | Size of the informal economy | |
| Measure | World Bank 2019 | Internet penetration (World Bank 2019) | Regulatory quality (World Bank 2021) | Rule of law (World Bank 2021) | World Bank 2019 |
| Correlation with Company Information score | 0.495 | 0.351 | 0.423 | 0.388 | -0.102 |
| Statistical significance at 10% | Yes | Yes | Yes | Yes | No |
Next steps
Whilst the sample size limited my ability to produce robust regressions that can isolate causal effects, the correlations described above suggest a number of interesting hypotheses to be investigated with more data and in-depth case studies. My last step was to include all the variables with a statistically significant correlation with the Company Information indicator in a backwards stepwise regression. This is a way of identifying the most important variables by removing variables one-by-one from the model to maximise explanatory power and model simplicity. This identified three variables as being the most important: recent experience of being greylisted by the FATF; the interaction of levels of corruption and democracy; and government effectiveness.
In practice, these variables are likely to interact and have different effects at different times. For example, a one-off event, such as the election of a government running on an anti-corruption platform or a FATF Mutual Evaluation, may create an opening for BOT reforms which are then supported or opposed by private interest groups, civil society, and policymakers. Complex causal processes are best investigated through in-depth analysis of specific cases, using qualitative methods such as process tracing.
To do this, I am starting with two cases: Indonesia and South Africa. Both have made significant progress in introducing BOT reforms in reference to both international pressure and domestic policy goals. For example, the South African government has brought forward BOT reforms in response to its greylisting by the FATF, and the Indonesian government has committed to BOT reforms in successive anti-corruption strategies. They are also comparable in their levels of democracy and economic development, as measured by international indices.
Lastly, I look forward to the publication of the next edition of the Global Data Barometer. There has been an incredible amount of progress on BOT reform since 2021, which will allow me to test the explanatory factors again with a higher sample size and explore changes over time. The more we can understand what factors are associated with BOT reform, the more effectively we can support it.
Footnotes
[1] The full list of countries I analysed is: Angola, Argentina, Armenia, Australia, Azerbaijan, Bangladesh, Belarus, Benin, Bolivia, Botswana, Brazil, Burkina Faso, Cambodia, Cameroon, Canada, Chile, China, Colombia, Costa Rica, Dominican Republic, Ecuador, Egypt, El Salvador, Ghana, Guatemala, Haiti, Honduras, India, Indonesia, Israel, Ivory Coast, Jamaica, Jordan, Kazakhstan, Kenya, Kyrgyzstan, Malawi, Malaysia, Mongolia, Morocco, Mozambique, Namibia, Nepal, New Zealand, Nigeria, Oman, Paraguay, Peru, Philippines, Rwanda, Saudi Arabia, Senegal, Sierra Leone, South Africa, South Korea, Sri Lanka, Tajikistan, Thailand, The Gambia, Togo, Trinidad and Tobago, Tunisia, Turkmenistan, Uganda, Uruguay, Uzbekistan, Vietnam.
[2] The Corruption Perceptions Index scores countries such that high levels of perceived corruption receive a low score, and vice versa. My analysis reversed this so that a high value indicated a high level of perceived corruption, to support the clarity of the argument.

Publication type
Blog post