Update to Beneficial Ownership Data Standard visualisation software

Beneficial ownership data is at its most useful when it can be understood by the widest possible audience. Simple visualisations of the data can help communicate it to more people.
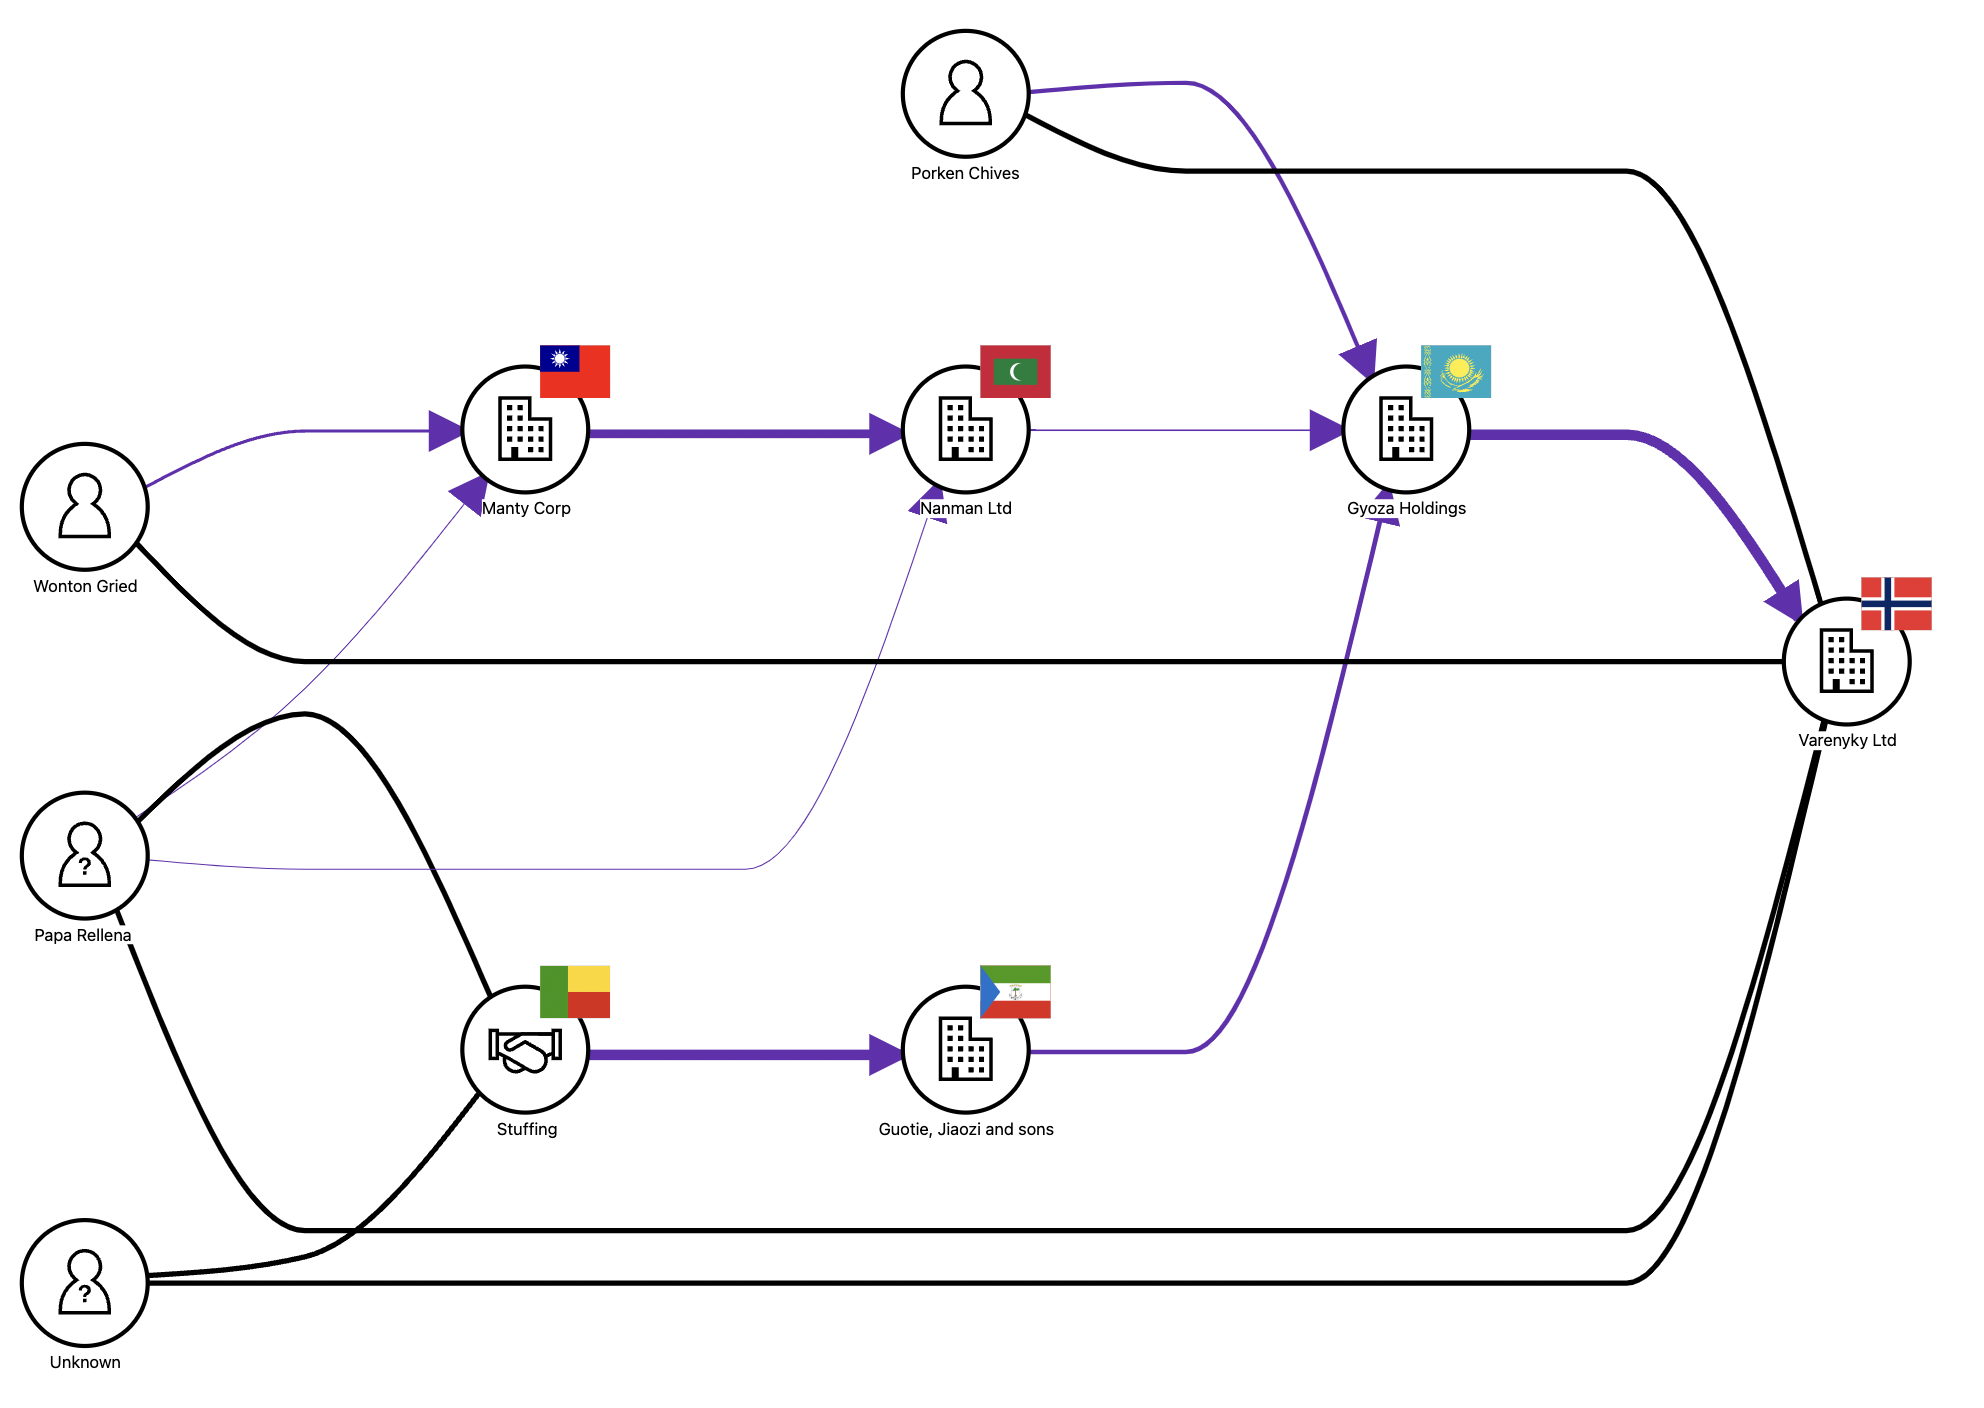
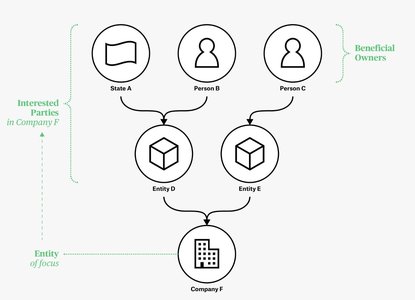
To help people visualise beneficial ownership data, Open Ownership created the Beneficial Ownership Visualisation System in 2020, along with free, open source data visualisation software to generate diagrams. The visualisation system specifies how to draw ownership structures as clearly as possible.
Open Ownership has a version of this tool hosted on its website where anyone can paste in data produced in line with the Beneficial Ownership Data Standard to instantly generate a beneficial ownership diagram.
Today, Open Ownership is unveiling an update to the software to make these diagrams clearer, more detailed, and downloadable in SVG format.
The following new features have been added:
- SVG download available for any diagram
- Directionality using arrows to better show the direction of relationships in diagrams
- Official Beneficial Ownership Visualisation System icons used
- Indirect beneficial ownership relationships shown as dotted lines
- Better flag consistency
- Allows users to submit data produced in line with upcoming v0.3 of the Beneficial Ownership Data Standard
Any publishers producing data in line with the Beneficial Ownership Data Standard can use this software to visualise their data, and anyone working with data can copy and paste it into Open Ownership’s hosted version to draw and download diagrams.
Details about how to use the latest version of this software can be found on Github or NPM.
To share feedback about this tool, please raise any issues on Github, or connect with the data team at Open Ownership via email at [email protected].
Related articles and publications
Publication type
Blog post
Topics
Beneficial Ownership Data Standard
Sections
Technology
Open Ownership Principles
Structured data

