Leveraging shareholder data for beneficial ownership transparency
Analysis of shareholder and beneficial ownership information
This section assesses how and to what extent shareholder data can contribute to understanding corporate networks and inform the design and implementation of BOT systems.
What the analysis examines
The analysis is guided by three questions:
1. Data overlap and alignment: To what extent do shareholder and BO registers capture the same ownership information?
This analysis compares the number of legal entities and individuals recorded in each dataset; identifies overlaps between the two sources; and assesses what information is shared versus uniquely captured. It helps evaluate the completeness, redundancy, and structural alignment of the two systems, as well as the limits of shareholder data in capturing beneficial ownership.
2. Interest types in BO data: What proportion of BO declarations relate to shareholding, compared to other forms of control (e.g. voting rights, appointment powers, or other means of control)?
This question assesses the relative importance of share-based ownership versus non-share-based control; the structural limits of shareholder data as a proxy for beneficial ownership; and the types of interests which are either captured only in BO data or only in shareholder data.
3. Domesticity of corporate networks: To what extent are corporate networks derived from shareholder data domestic, and how does this compare with those derived from BO data?
This analysis examines the geographical scope of corporate networks in each dataset, assessing their relative capacity to identify foreign ownership and cross-jurisdictional chains. It highlights where shareholder data may be structurally limited in capturing transnational ownership.
Case studies
This analysis relies on access to structured BO and shareholder data. Therefore, the study is limited to two case studies: Estonia and Zambia.
Estonia
In Estonia, the electronic e-Business Register (e-Äriregister), managed by the Centre of Registers and Information Systems (RIK) includes a centralised shareholder register. With some exceptions, a company’s list of shareholders is generally kept by the e-Business Register, meaning shareholders’ data has legal meaning, and is therefore deemed to be up to date and accurate. To illustrate, shares are deemed to have been issued and transferred when an entry is made in the e-Business Register. [20] Some legal entity types are registered elsewhere, such as with the register of non-profit associations and foundations, but are still required to declare beneficial ownership to the e-Business Register. [21] By contrast, public limited companies are registered with the e-Business Register but register their shares in the Estonian Central Register of Securities. [22]
The Estonian BO register for legal entities is an integral part of the electronic e-Business Register. The obligation has been effective since 2018, leveraging Estonia’s advanced e-governance infrastructure. All legal entities registered in Estonia, with few exceptions, are required to identify, record, and disclose up-to-date information about their beneficial owners within 30 days of a change. This is governed by the Money Laundering and Terrorist Financing Prevention Act. [23]
Both datasets are publicly available for download via online portals, bulk downloads, and API services. [24] For this paper, the datasets were downloaded on 11 February 2026 and matched using a hashed personal identifier for individuals and a company registry code for legal entities, enabling precise comparison between shareholder and BO records. All interests are assumed to be current (the end date is null for all entries).
Zambia
In Zambia, both the shareholder register and BO register for legal entities are managed by the Patents and Companies Registration Agency (PACRA). Shareholdings are recorded by companies themselves and considered issued when the company updates its own register. Companies have an obligation to update PACRA of any changes within 14 days, and are assumed to be relatively accurate and up to date.
Zambia’s BO disclosure regime is undergoing changes in response to a number of shortcomings in the legislation and systems. While Zambia amended its Companies Act in 2025, the current BO dataset was collected under the previous legislation. [25] Although beneficial ownership is broadly defined within the previous Act, it is mostly mentioned in respect to shares or shareholding. [26] In the system, declarants are asked to disclose the shareholders of a company, then to declare beneficial ownership of those shares. The legislation has been amended and Zambia also plans to capture beneficial ownership with non-shareholder interests. Companies similarly need to disclose updated BO information to PACRA within 14 days of a change.
Recent evidence indicates a relatively low compliance rate, with an estimated 38–44% of companies having submitted BO information. [27] PACRA is undertaking reforms to modernise the company and BO registers in partnership with Open Ownership to improve data quality as well as strengthen compliance and enforcement mechanisms. [28] Through this partnership, anonymised shareholder and BO datasets were provided by PACRA on 13 February 2026, with hashed personal identifiers and hashed company numbers. As Zambian data does not include an end date field, all interests are assumed to be current.
Limitations
Together, these cases provide a complementary basis for examining how shareholder and BO data interact across different institutional and data contexts. The study’s main limitation is the small sample, given the challenges in accessing both structured shareholder and BO data for a jurisdiction. Additionally, there are limitations due to the characteristics of the Zambian BOT regime discussed above.
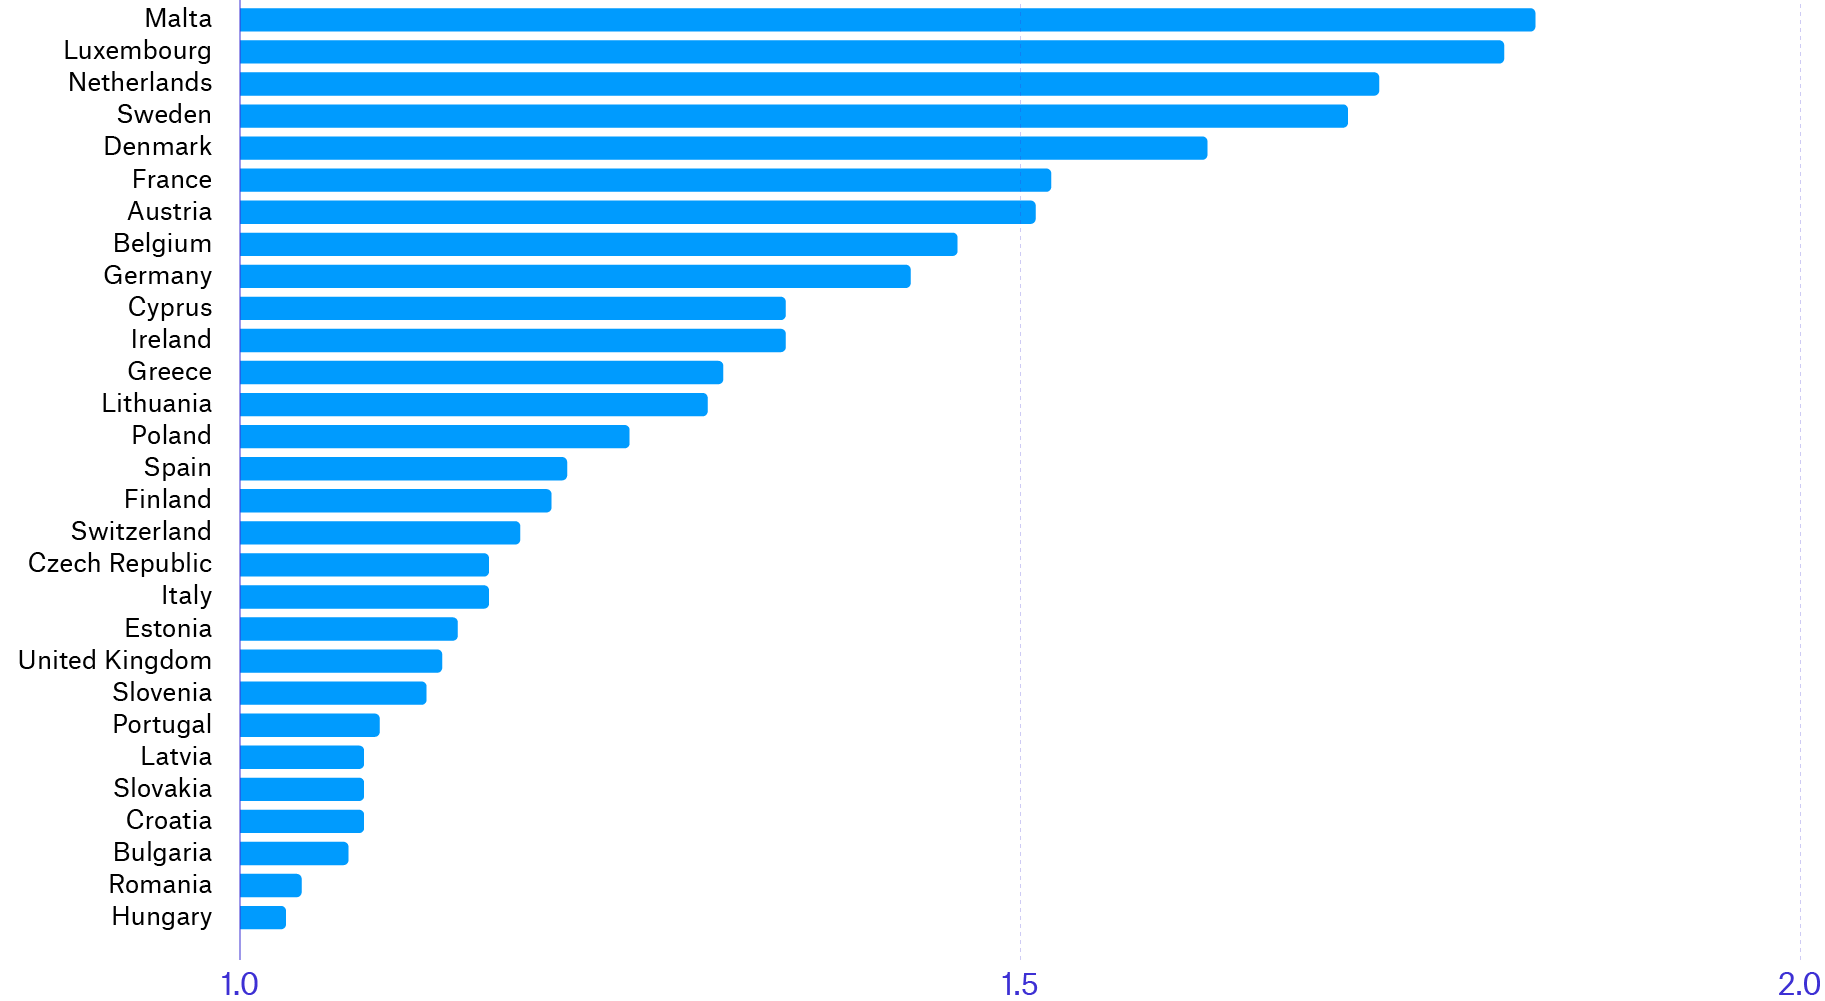
Despite these limitations, there are reasons to believe these insights are more broadly applicable. Ownership structures appear to be relatively simple for most companies, with beneficial owners holding direct interests in a company rather than through multiple layers of intermediary entities. Across Europe, for instance, beneficial owners typically hold direct stakes – the corporate structures have one layer – suggesting that most of these relationships are already visible through shareholder information (see Figure 2). [29]
Figure 2. Average number of layers between a reporting company and its beneficial owners in Europe (where 1 = direct ownership) [30]
What the data shows
Data overlap and alignment
Table 1 compares the shareholder (SH) and BO datasets in the Estonia and Zambia case studies, showing the number of companies and individuals recorded in each dataset, as well as the extent of overlap and dataset-specific records. The figures cover companies and individuals only, and exclude corporate shareholders. The results reveal markedly different patterns across the two contexts.
Table 1. Coverage and overlap between shareholder and beneficial ownership datasets (Estonia and Zambia)
| Country | Unit of analysis | SH dataset | BO dataset | Overlap (BO/SH) | Only in SH | Only in BO |
|---|---|---|---|---|---|---|
| Estonia | Companies (registry code) | 280,862 | 295,010 | 266,868 | 13,994 | 28,142 |
| Estonia | Individuals (hashed ID) | 237,347 | 246,008 | 211,516 | 25,831 | 34,492 |
| Zambia | Companies (hashed company number) | 555,809 | 104,689 | 104,637 | 451,172 | 52 |
| Zambia | Individuals (hashed ID) | 699,821 | 193,212 | 189,940 | 509,881 | 3,272 |
Estonia
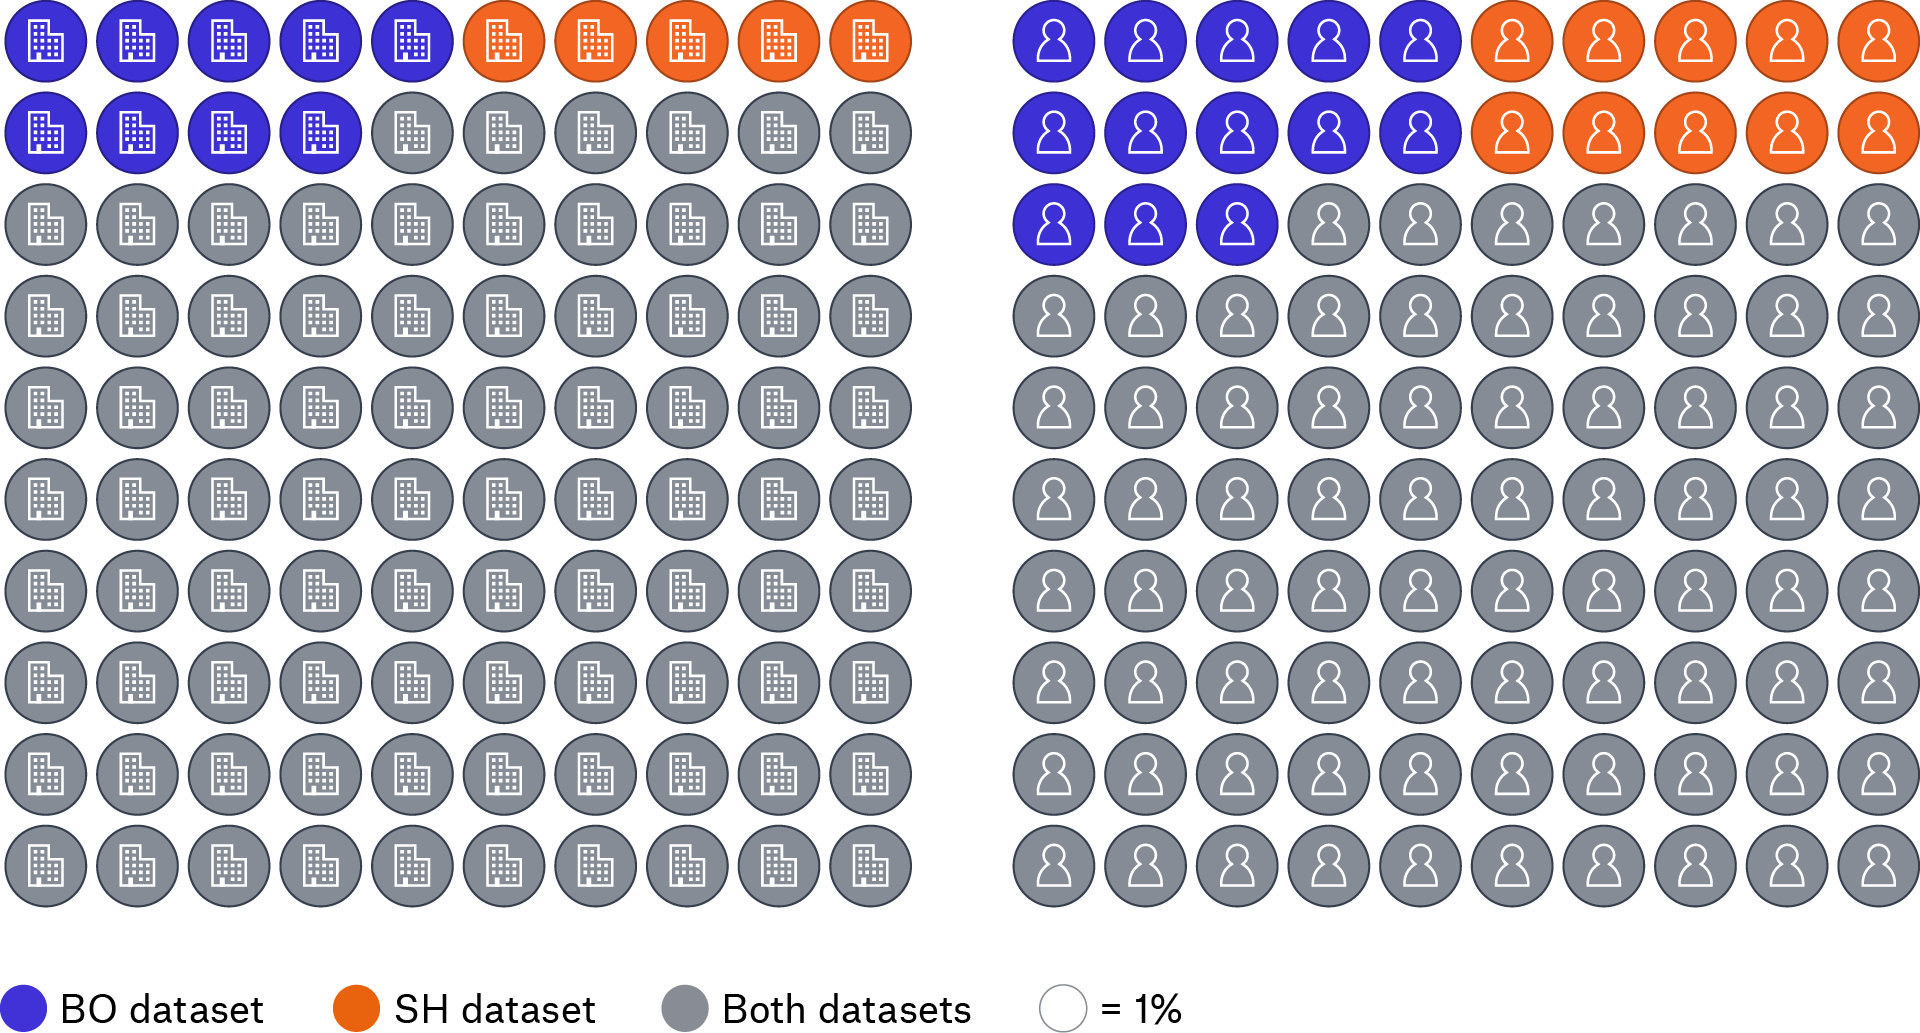
Estonia shows substantial overlap between shareholder and BO datasets, with both sources covering largely similar populations of companies and individuals (Figure 3). Most records appear in both datasets, indicating strong structural alignment between the two systems.
At the same time, each dataset contains a subset of companies and individuals not present in the other. This indicates that, while shareholder data captures a significant share of the ownership relationships later reported through BO declarations, BO data provides additional, distinct information not observable through shareholder records alone.
Of the 25,831 individuals only present in the Estonian shareholder dataset, 39% (almost 10,000 individuals) hold ownership shares of 25% or less (the threshold for being considered a beneficial owner). The remaining 61% (15,849 individuals, or approximately 7% of all individuals in the shareholder data) report shares above this threshold. Further research may be required to explain this latter group. Possible reasons include noncompliance with BO reporting, differences in reporting timelines, exemptions to BO reporting requirements, or other factors not yet explored.
Figure 3. Distribution of companies and individuals across datasets (Estonia)
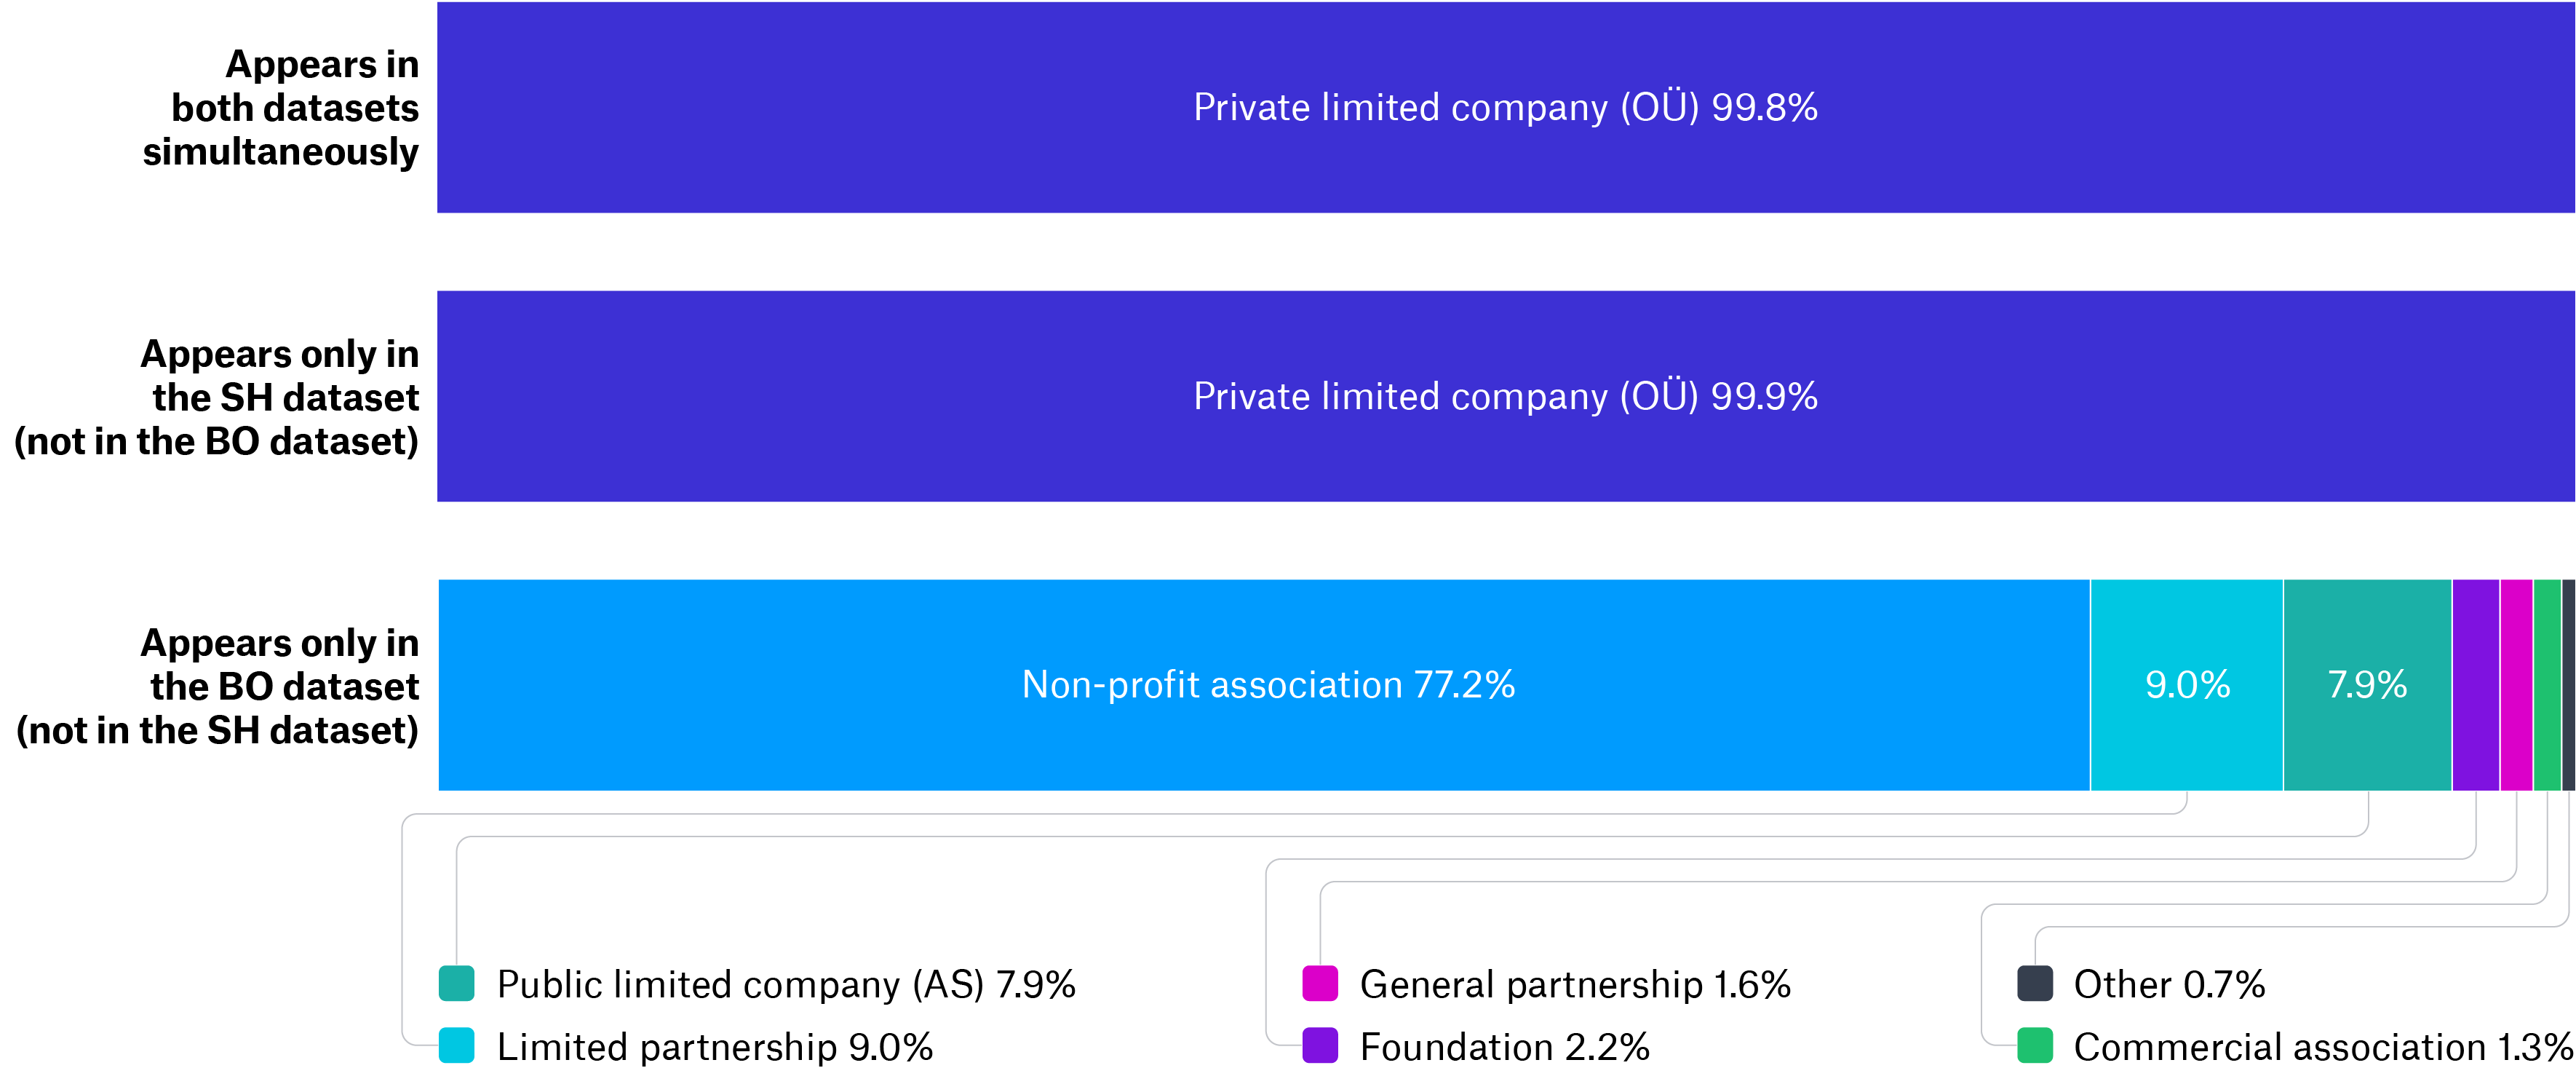
Entities appearing in both datasets, as well as those only captured in shareholder data, are predominantly private limited companies. By contrast, BO data covers a wider range of legal entity types (Figure 4). These entities may not have shareholders (such as foundations) or may register their shares in separate systems. As a result, shareholder data primarily captures ownership information for private limited companies, although this is the most common entity type.
Figure 4. Distribution of company legal forms across datasets (Estonia)
Zambia
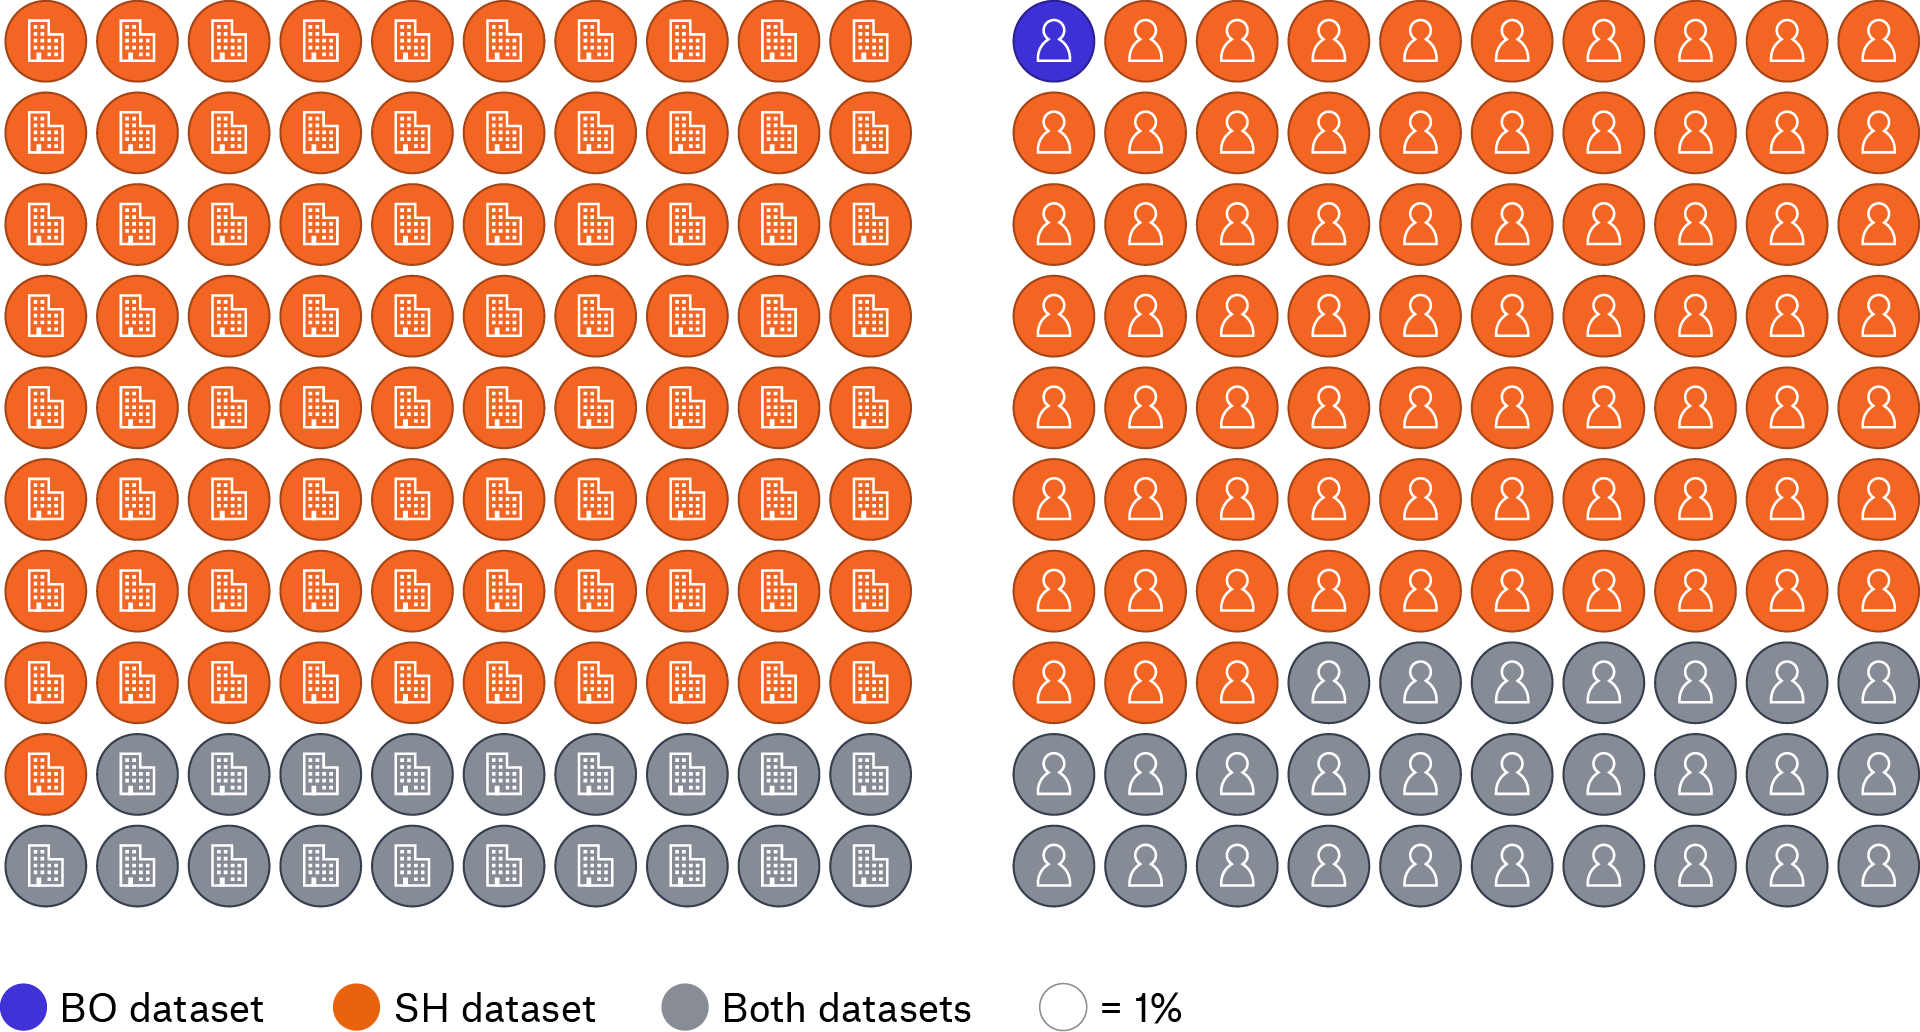
The Zambian case presents a markedly different configuration (Figure 5). Nearly all companies and individuals recorded in the BO register can be matched to shareholder records. By contrast, the shareholder dataset includes a very large number of additional entities and individuals not reflected in BO declarations. As a result, BO records represent a relatively small subset of the overall population captured in shareholder data.
Figure 5. Distribution of companies and individuals across datasets (Zambia)
This pattern suggests that many companies recorded in the shareholder register are not captured in the BO dataset, indicating that BO information is missing for a substantial part of the registered population. While part of this difference may reflect reporting thresholds or other factors, the scale of the discrepancy is also consistent with incomplete compliance with BO disclosure requirements.
Interest types in beneficial ownership data
Corporate networks are often relatively simple and based on direct shareholding by a small number of individuals. In such cases, a high degree of overlap between shareholder and BO data is expected. However, BO data also captures forms of control that are not reflected in shareholding, including indirect ownership and other means of control.
Estonia
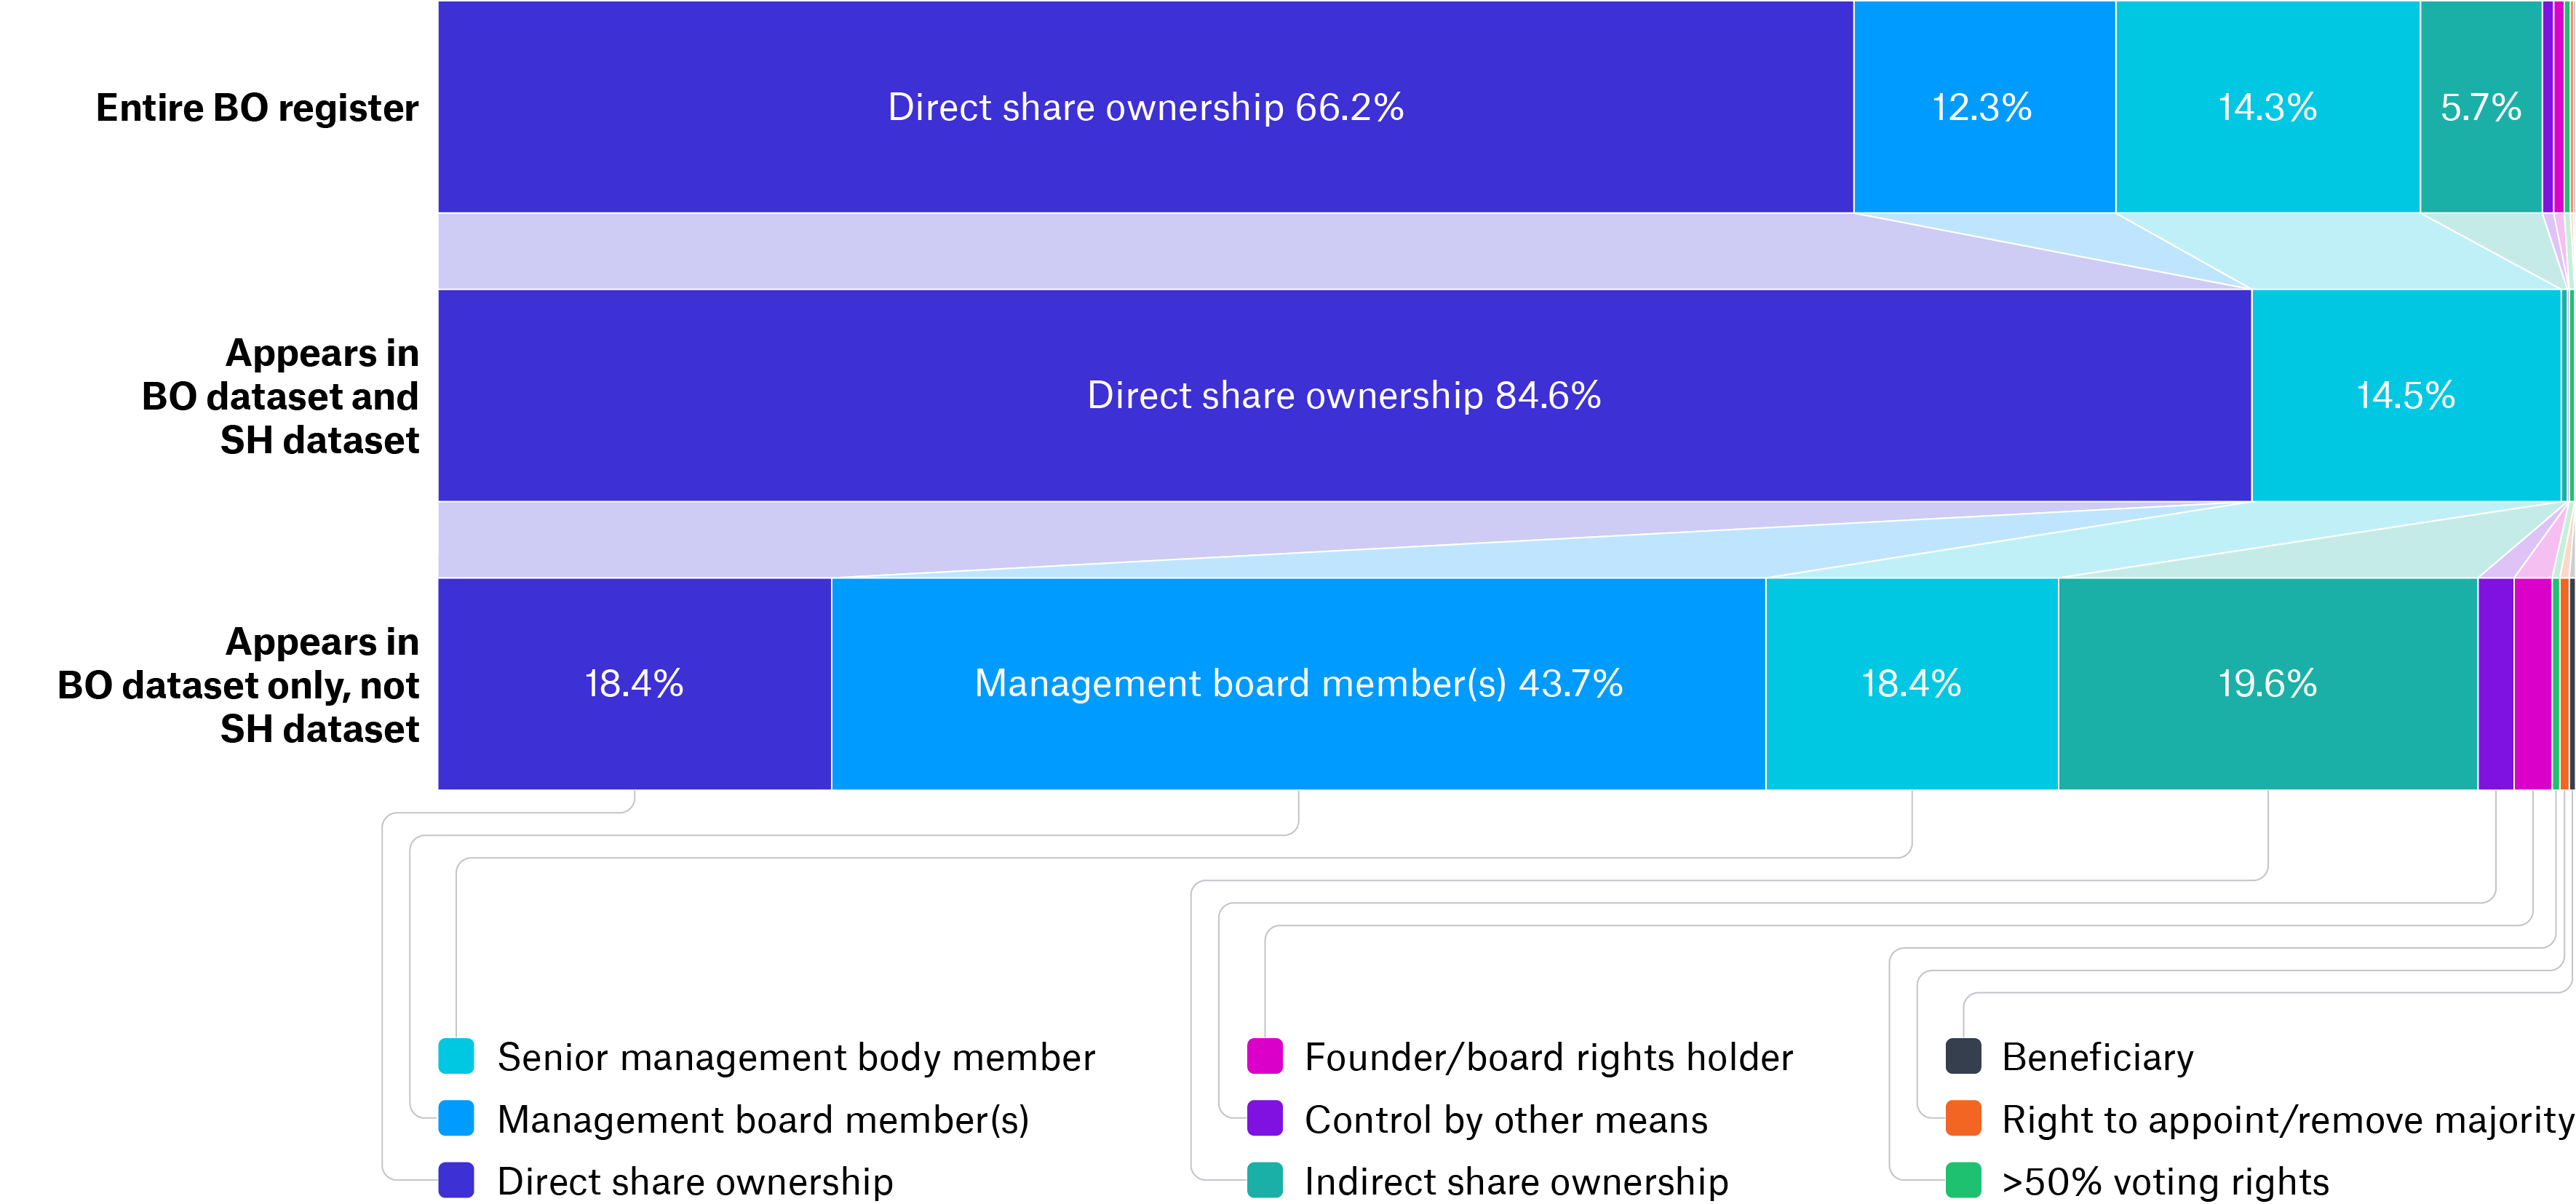
In Estonia, BO data includes several types of declared interests, with direct share ownership representing the largest category (Figure 6). Amongst the companies that are also represented in the shareholder register, direct share ownership and senior management roles are proportionally more prominent. By contrast, companies only appearing in the BO dataset show a higher relative share of non-share-based interests, particularly management board membership and indirect share ownership. Instances of direct share ownership appearing only in the BO data may reflect entity types whose shares are not recorded in the business register.
Figure 6. Distribution of interest types in Estonia’s beneficial ownership dataset
Zambia
In Zambia, the distribution is more heavily concentrated on direct ownership, consistent with the broader coverage of shareholder data observed earlier (Figure 7). However, within the BO-only segment, there is a relatively greater presence of other forms of control, including control by other means, management board membership, and voting or appointment rights.
Figure 7. Distribution of interest types in Zambia’s beneficial ownership dataset
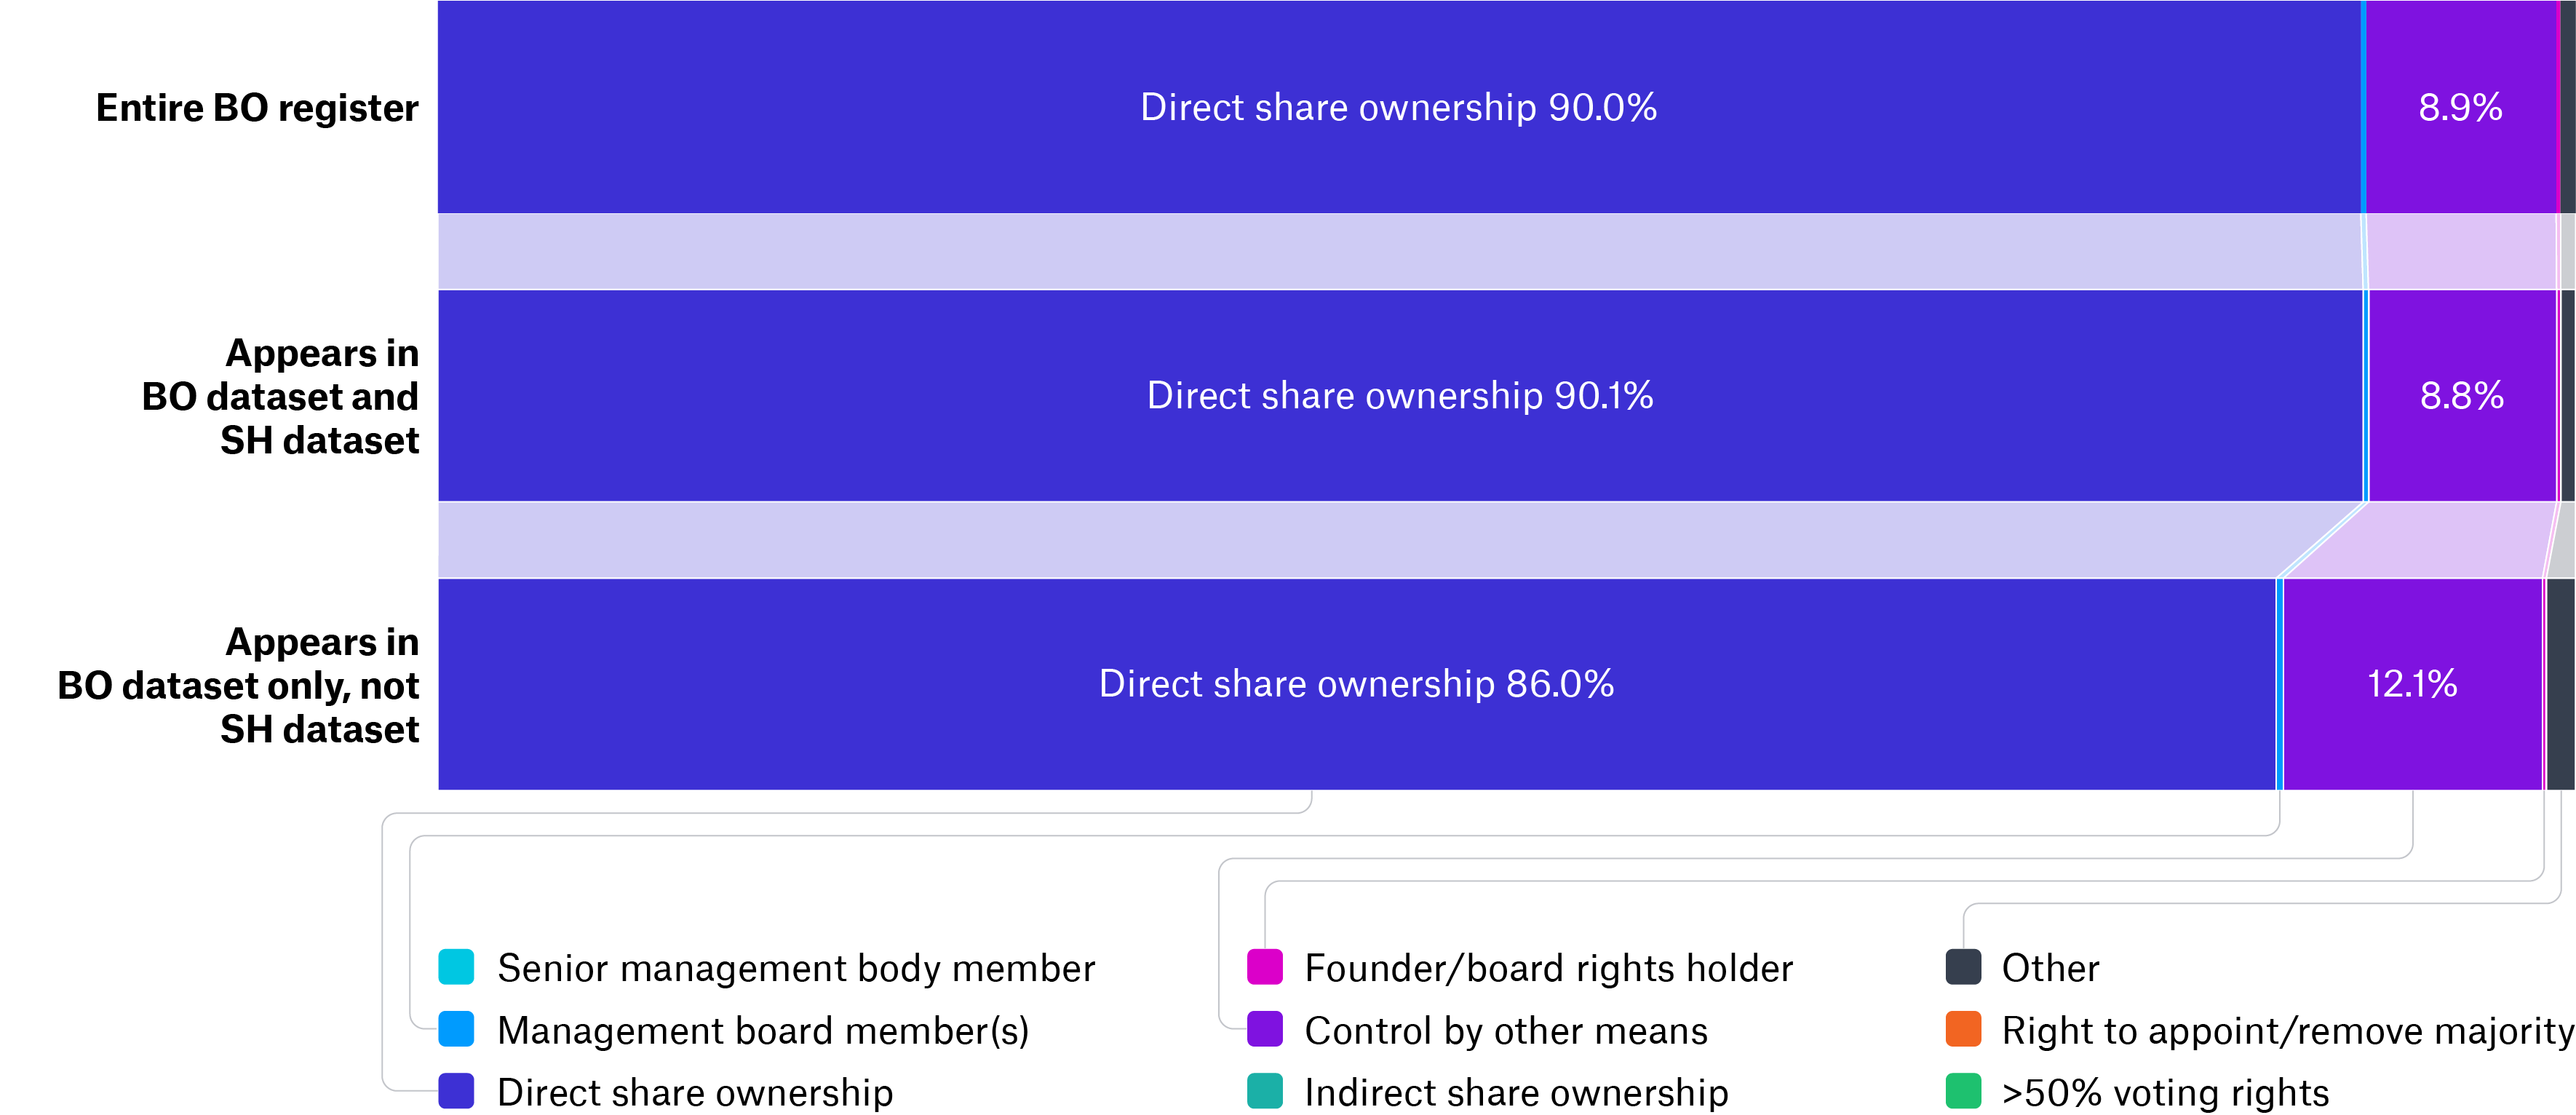
These results reflect the deficiencies in the former Zambian BO disclosure regime outlined above, with information about BO being collected in relation to shareholdings. Additionally, the dataset records interest types in free-text fields, resulting in inconsistent categories, variations in terminology, and typographical errors. While the data was processed and mapped into broader categories based on the available descriptions, this introduces uncertainty in the classification. This highlights the importance of structured data collection using standardised categories, aligned with legal definitions, to enable consistent analysis and comparison across datasets.
Domesticity of corporate networks
While many corporate networks are relatively simple, they can also involve multiple layers of intermediary entities and links across jurisdictions. These cross-border elements may arise through foreign intermediary companies or through individuals who are non-residents or hold foreign nationality.
For the purposes of this analysis, a corporate network is defined as the set of ownership relationships linking a given legal entity to its direct and indirect beneficial owners. Each legal entity is treated as the starting point of a distinct network, even where ownership chains overlap. For instance, where one legal entity is owned by another legal entity, which in turn is owned by an individual, this is treated as two separate networks: one centred on the first entity (with multiple ownership layers) and one centred on the intermediary entity (with a single ownership layer). This approach allows for consistent comparison across entities and avoids combining partially overlapping structures.
In this context, domestic networks refer to ownership structures in which all relevant parties – both companies and individuals – are located within the same jurisdiction. Distinguishing between domestic and cross-border networks is key to understanding the geographical reach of ownership structures and the extent to which they can be fully observed within a single country.
Table 2 presents comparative statistics on the domesticity and cross-border characteristics of corporate networks based on shareholder and BO data in Estonia and Zambia. As above, the results reveal contrasting patterns across the two contexts.
Table 2. Domestic and cross-border characteristics of corporate networks (Estonia and Zambia)
| Statistic |
Estonia (n = 309,004) |
Zambia (n = 555,861) |
|---|---|---|
| Count | Percentage | Count | Percentage | |
| Entities in domestic networks | 270,654 | 88% | 476,189 | 86% |
| Entities where all beneficial owners are domestic | 260,353 | 84% | 78,072 | 14% |
| Entities where all individual shareholders are domestic | 266,812 | 86% | 476,372 | 86% |
| Entities where all corporate shareholders are domestic | 23,934 | 8% | 13,327 | 2% |
|
Entities only present in SH data that only have domestic individuals as shareholders |
7,384 | 2% | 396,382 | 71% |
| Entities with foreign beneficial owners | 35,406 | 11% | 29,148 | 5% |
| Entities with foreign shareholders (total) | 11,497 | 4% | 79,136 | 14% |
| └─ of which: foreign corporate shareholders | 4,751 | 2% | 4,404 | 1% |
| └─ of which: foreign individual shareholders | 7,384 | 2% | 78,795 | 14% |
|
Entities with foreign beneficial owners and only domestic shareholders |
26,853 | 9% | 536 | 0% |
Estonia
In Estonia, the vast majority of corporate networks are domestic, with 88% of entities showing no links to foreign jurisdictions through either intermediary entities or individuals. This aligns with the fact that 98% of entities do not have foreign shareholders.
At the same time, 4% of companies have foreign shareholders (either corporate or individual), while 11% have foreign beneficial owners. Notably, 9% of networks consist entirely of domestic shareholders (companies or individuals) but include at least one non-domestic beneficial owner, suggesting that cross-border elements may only become visible at the BO level – except where foreign individuals hold shares directly, in which case the full network remains visible within domestic shareholder data.
Only 8% of corporate structures involve domestic corporate shareholders, while 2% involve foreign corporate shareholders. This means the majority of multi-layered networks are domestic, and their intermediaries can be understood through domestic shareholder data.
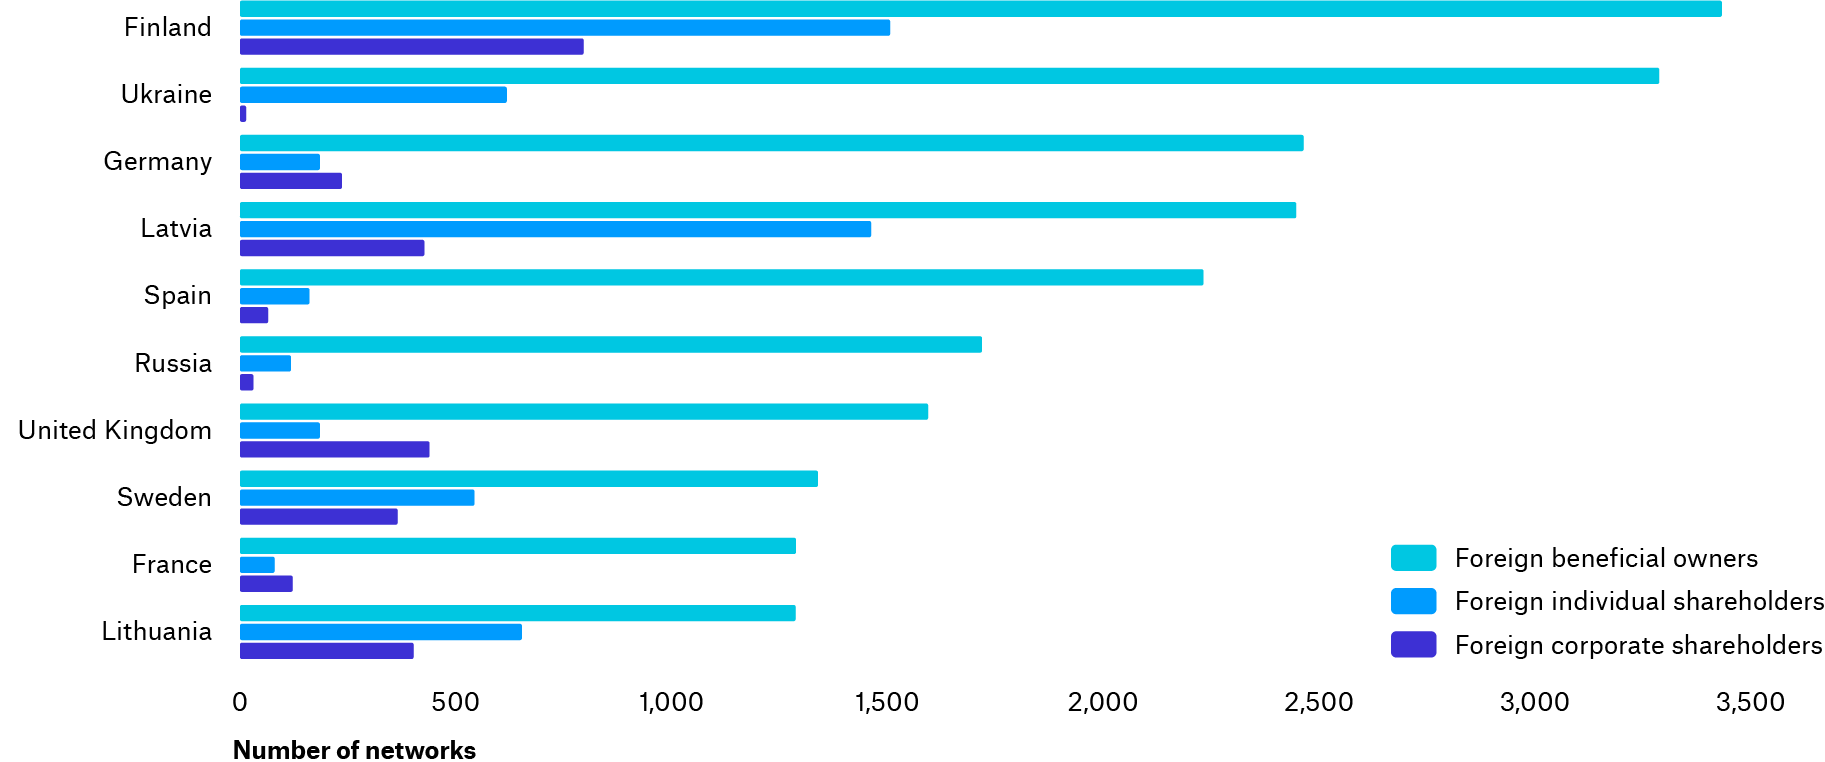
Overall, shareholder data presents a more domestic view of ownership structures, while BO data reveals additional cross-border links not observable through shareholding alone, albeit for a relatively small proportion of networks (Figure 8). This pattern is particularly pronounced for connections with France, Germany, Russia, Spain, and Ukraine, where foreign links are more frequently captured in BO data. By contrast, countries such as Finland, Latvia, Lithuania, and Sweden show a more balanced distribution across both datasets.
Figure 8. Top 10 foreign countries in corporate networks (Estonia)
Zambia
In Zambia, most corporate networks are also domestic, with 86% showing no links to foreign jurisdictions. While lower BO reporting compliance may overestimate this number, 99% of entities do not include foreign companies as shareholders. However, the small proportion of complex, cross-border networks are disproportionally relevant to policy objectives such as fighting financial crime, underscoring the need for effective data-sharing across jurisdictions.
A substantially higher number of entities include foreign shareholders (79,136) – either corporate or individual – than foreign beneficial owners (29,148). This likely reflects gaps in BO reporting rather than an absence of cross-border networks. In this context, shareholder data may provide a more reliable starting point for identifying cross-border links and supporting compliance with BO reporting. Because 71% of entities only present in shareholder data just have domestic individuals as shareholders, PACRA may already have BO information for almost 400,000 companies that have not reported their beneficial owners. Although not all of these companies may be subject to BO reporting requirements, and some may be inactive, it indicates that leveraging shareholder information also has the potential to contribute significantly to current compliance levels.
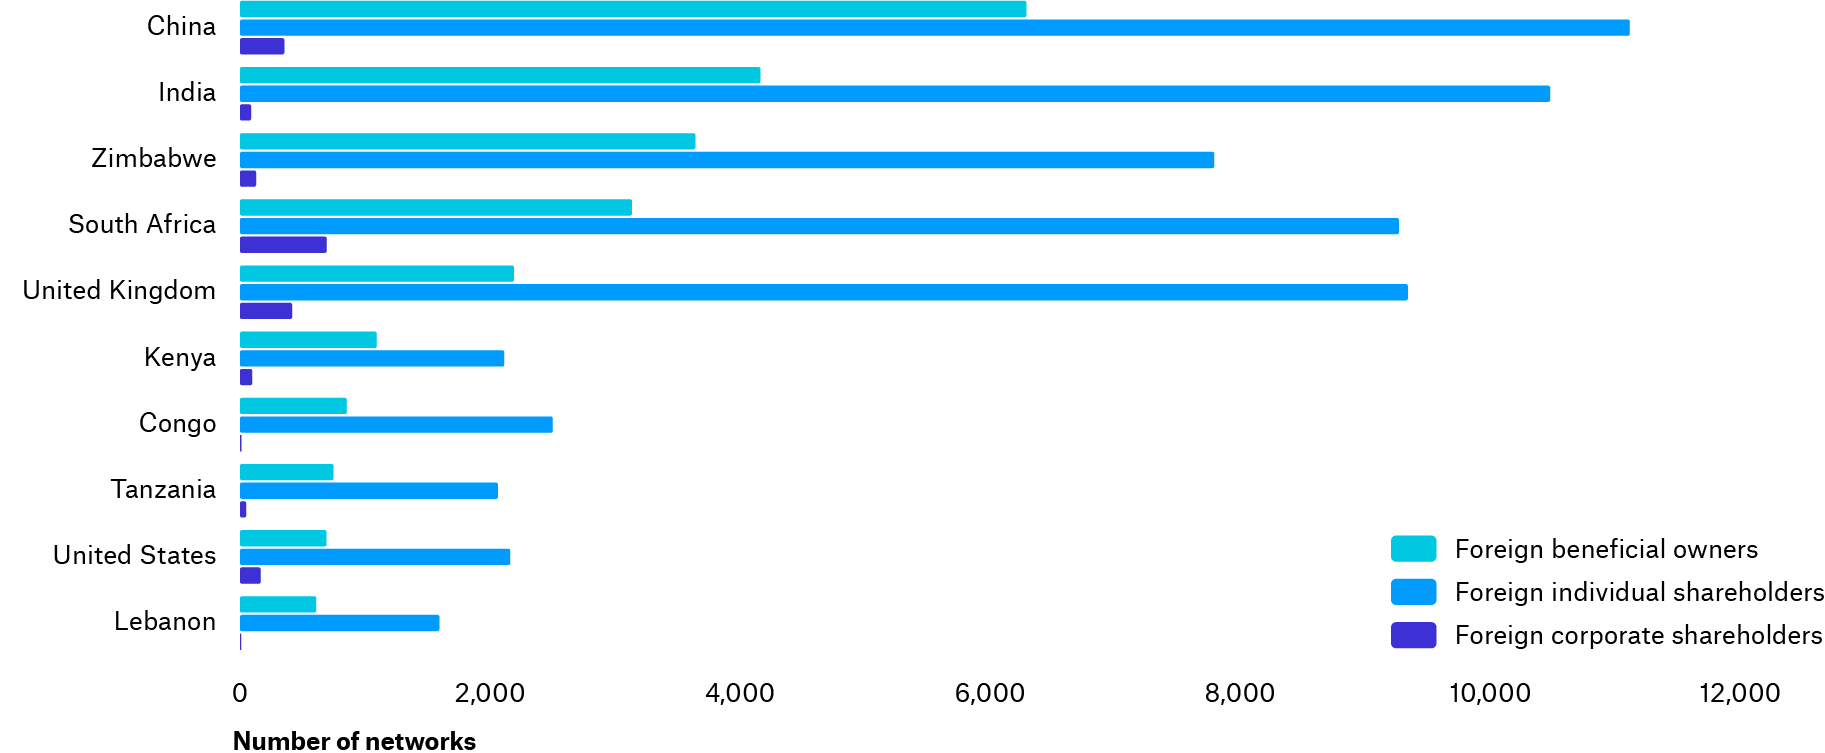
BO data in Zambia presents a more domestic view of ownership structures, while shareholder data reveals additional cross-border links (Figure 9). Cross-border links in BO data are more concentrated in a smaller set of jurisdictions, particularly China, India, South Africa, the UK, and Zimbabwe.
Figure 9. Top 10 foreign countries in corporate networks (Zambia)
Footnotes
[20] Riigi Teataja, Commercial Code, 27 February 2024, https://www.riigiteataja.ee/en/eli/ee/511012016002/consolide/current.
[21] European e-Justice Portal, “Business registers in EU countries: Estonia”, updated 20 September 2022, https://e-justice.europa.eu/topics/registers-business-insolvency-land/business-registers-eu-countries/ee_en.
[22] EESTI.EE, Riigiportaal, “Founding a foundation”, updated 13 March 2024, https://www.eesti.ee/eraisik/en/artikkel/doing-business/establishing-a-company/founding-a-foundation; Invest in Estonia, “Public limited company (AS)”, n.d., https://investinestonia.com/business-in-estonia/establishing-company/legal-forms/limited-public/.
[23] Riigi Teataja, “Money Laundering and Terrorist Financing Prevention Act”, 17 November 2017, https://www.riigiteataja.ee/en/eli/517112017003/consolide.
[24] Shareholders: E-Business Register, home page, n.d., https://ariregister.rik.ee/eng. Beneficial owners: E-Business Register, “Beneficial owners”, n.d., https://ariregister.rik.ee/eng/beneficial_owners_query. Also see: E-Business Register Open Data, “Shareholders”, n.d., https://avaandmed.ariregister.rik.ee/en/downloading-open-data#pk-6.
[25] Mulenga Mundashi Legal Practitioners, “Zambia Introduces Sweeping Corporate Transparency Reforms Targeting Beneficial Ownership”, Afriwise, 21 January 2026, https://www.afriwise.com/blog/zambia-introduces-sweeping-corporate-transparency-reforms-targeting-beneficial-ownership.
[26] Zambia Legal Information Institute, Companies Act, 2017, 20 November 2017, https://zambialii.org/akn/zm/act/2017/10/eng@2017-11-20#page-1.
[27] Augustine Sichula, “PACRA unveils three-year plan to modernize Zambia’s beneficial ownership registers, promote integrity”, Zambia Monitor, 23 January 2026, https://www.zambiamonitor.com/pacra-unveils-three-year-plan-to-modernize-zambias-beneficial-ownership-registers-promote-integrity/; Lazarous Tembo, “PACRA, Partners Roll Out Major Business Ownership Transparency Project”, Efficacy News, 26 January 2026, https://efficacynews.africa/2026/01/26/pacra-partners-roll-out-major-business-ownership-transparency-project/. While compliance rates are increasing and these rates may not fully correspond to the date the dataset was retrieved, it is unlikely to have increased significantly.
[28] Sichula, “PACRA unveils three-year plan”; Miranda Evans, “Beneficial ownership and business register reform in Zambia: Announcing our new partnership with PACRA”, Open Ownership, 6 March 2026, https://www.openownership.org/en/blog/beneficial-ownership-and-business-register-reform-in-zambia-announcing-our-new-partnership-with-pacra/.
[29] Antonio Bosisio, Carlotta Carbone, Maria Jofre, Michele Riccardi, and Stefano Guastamacchia, Project DATACROS: Developing a Tool to Assess Corruption Risk factors in firms’ Ownership Structures (Transcrime – Università Cattolica del Sacro Cuore, 2021), 29-30, https://www.transcrime.it/wp-content/uploads/2021/09/Datacros_report.pdf.
[30] Adapted from: Bosisio et al., Project DATACROS, 29.