Measuring the impact of beneficial ownership transparency in public procurement: Starter guide
Measuring the impact of beneficial ownership transparency in public procurement
Measuring impact helps determine whether BO reforms are having positive effects like protecting public money and improving competition. When designing an impact measurement approach, key aspects include:
1. Understanding the policy context:
Considering how BO transparency fits into broader government integrity policies.
2. Designing a tailored evaluation:
Choosing methods that suit one’s data, capacity, and policy goals.
3. Focusing on risks and benefits:
Focusing on BO transparency’s specific value-add in public procurement processes.
1. Understanding the policy context
Creating a BO register is not a stand-alone measure, but one that interacts with other government policies. The real-world effects of this information being available and used by procurement authorities and other actors is likely to be influenced by factors in the legal and policy environment in which the register is implemented. Those designing impact-measurement research need to consider factors at four levels of governance that can influence the design and feasibility of their project, as well as the robustness and meaning of their findings. These are outlined below.
1. Trust in government, anti-corruption, and democracy
This level looks at a jurisdiction’s overall governance environment and level of corruption, asking questions such as: Do BO transparency and procurement reforms reflect genuine political will to improve good governance? Is obedience to the law already high, despite loose statutory rules and enforcement?
For instance, in contexts where trust in government is low or there is systemic corruption, a BO register may be established but fail to achieve impact, as key actors may lack resources, capacity, or incentives to effectively use the data. BO transparency reforms might be less effective if implemented as the result of international pressure (e.g. by the FATF) rather than reflecting genuine domestic political will. [16] Finally, there may be a lack of impact of BO transparency if the misuse of legal vehicles was already rare due to a generally robust rule of law.
Examples of factors research can consider include:
- level of trust in government (e.g. the Organisation for Economic Co-operation and Development (OECD), World Bank); [17]
- corruption perception (e.g. Transparency International); [18]
- rule of law (e.g. World Justice Project); [19] and
- the type of democracy (e.g. Varieties of Democracy (V-Dem)). [20]
2. Transparency rules
This level focuses on the extent to which rules are in place in a jurisdiction to achieve principles of transparency, integrity, and sound management of public finances. It asks questions such as: Do data users have the legal right and practical ability to access and use the data they need? Are there rules that restrict the unethical behaviour of public officials, disclose the behaviour of public actors, or both?
A researcher may need to consider that if the overall transparency of governance is limited, it may diminish the impact of a BO register, regardless of how well it is implemented technically. BO transparency can also be more impactful when the data is interoperable with other key anti-corruption or procurement-related datasets, which in turn should be accessible and machine-readable. Some of the most important complementary sources include data on contracting authorities and procurement officials responsible for specific contracts; interest and asset declarations; and data on political financing and lobbying.
Research could consider, for example:
- the existence and quality of statutory measures against COIs, as well as their scope (e.g. whether they cover political appointees, civil servants, judiciary, parliaments, or local officials); [21]
- the existence of a legal right of access to information for citizens, the quality of this information (e.g. whether it is machine-readable), and the existence of public datasets; [22] and
- the existence of enforcement mechanisms for transparency measures (e.g. sanctions, independent supervisory bodies, whistleblower protection, and limited exemptions).
3. Integrity rules for public procurement
This level focuses on the extent to which a jurisdiction has integrity rules specific to preventing corruption in public procurement and contracting. It asks questions such as: Are COIs effectively managed? Are there codes of conduct requiring the reporting of a COI as soon as it arises?
Depending on integrity rules and their enforcement, the legal and political consequences of a BO register may be limited, as well as the relevance of the information it contains. For instance, BO information may reveal a potential COI, but if there are not clear rules and processes in place that define and sanction such conflicts, the impacts may be limited. The institutional setting can also influence what is relevant to measure. For instance, where COIs are not prohibited by law, revealing a COI could still have political consequences, and could therefore be the focus of a study (rather than, for instance, legal consequences). International agreements may also influence how a jurisdiction regulates public procurement domestically (Box 3).
Research could consider, for example:
- the existence, comprehensiveness, and enforcement of statutory COI prohibitions in public procurement;
- how broad the rules are in terms of who is covered (e.g. public officials and their family members being prohibited from being suppliers to their agencies or government); and
- the presence of voluntary COI codes of conduct adopted by contracting authorities.
4. Measures against collusive and other illicit practices in public procurement
The final layer focuses on provisions for the detection and sanctioning of fraudulent practices involving multiple connected entities. It asks questions such as: Are there real consequences for companies engaging in collusion and other anti-competitive behaviour? Are there red-flagging mechanisms or other tools to detect and investigate such behaviour?
As with integrity rules, the extent and effectiveness of administrative and legal sanctions for collusion and other anti-competitive behaviour like bid-rigging will influence whether the use of BO information in detecting it has any effect. Typically, a country’s competition authority will play a key role here, and it should have an adequate legal mandate, resources, and independence to investigate suspicious cases. The extent to which it cooperates with other oversight authorities such as anti-corruption agencies can also affect real-world outcomes.
Research could consider, for example:
- the legal consequences of collusion and bid rigging, with indicators such as the existence of administrative or criminal sanctions; and
- how a jurisdiction handles the participation of multiple bidders connected through beneficial ownership (e.g. the extent of contracting authorities’ activities to identify and investigate illicit behaviour, and use of approaches like automated red flagging).
Box 3. Influence of trade commitments on jurisdictions facing opacity in procurement
Jurisdictions facing corporate opacity, whether stemming from domestically registered companies or from foreign entities, are often constrained in their ability to directly prohibit such companies from participating in public procurement. Doing so could conflict with international obligations, such as those arising under the Agreement on Government Procurement (GPA) or other trade commitments. [23] In this context, regulation requiring the disclosure of BO structures has proven to be a valuable and effective tool.
The principle of non-discrimination is a cornerstone of the GPA. [24] At the same time, the avoidance of COIs is a key requirement for conducting public procurement in a transparent and impartial manner. [25] Accordingly, the establishment of a BO register for the purposes of public procurement transparency may pursue a legitimate aim under the GPA.
However, any obligation to declare information to a BO register must be subject to non-discriminatory conditions and must not impose undue obstacles on foreign companies that could be considered discriminatory. The data and documentation required for registration must also not exclude foreign entities in practice. Moreover, bilateral trade agreements may contain specific provisions on national treatment, market access, or the opening of public procurement markets, which should also be taken into account.
2. Designing a tailored evaluation
Having diagnosed the governance context in which a study will take place, the following three-track evaluation framework offers the option of taking a single or multi-track approach to impact assessment (Table 1). The different tracks provide a flexible approach that can be tailored to jurisdictions with different policy aims, governance environments, data conditions, and institutional capacities. This framework also links to the eleven measurable benefits of BO transparency for procurement listed in the following section.
Table 1. Summary of the three-track evaluation framework
| Track | Focus of activities | Example research questions |
|---|---|---|
| Track A: Survey or interview-based measurement | Capturing perceptions, observable use, or behaviour change related to BO information through surveys and interviews | Do public officials find BO information useful for their work? Has it increased perceptions of trust and competition among businesses? |
| Track B: Correlational and comparative analysis | Using data to find patterns and relationships between BO transparency and procurement outcomes | Did competition increase after a BO register was launched? Did the prevalence of suspected or confirmed COIs decrease? |
| Track C: Framework mapping and policy alignment | Positioning BO transparency implementation within the broader policy and regulatory landscape | How do BO transparency reforms align with international standards? Are we measuring the right things to influence our audience? |
Track A: Survey or interview-based measurement
Track A uses qualitative methods to measure how people perceive and report using BO information and its value to their work. This is the most flexible track, and it can be used even where there is limited administrative data. Administrative data is information collected by organisations primarily for operational or administrative purposes, rather than for research or statistical analysis. It is recommended to create targeted survey instruments for each stakeholder group that are aligned with specific BO transparency-related benefits (see Track B).
The following is a (non-comprehensive) example of what Track A might look like:
- Public sector:
Ask officials such as procurement officers, competition authority staff, auditors, or anti-corruption agency staff about how they acquire and use BO information and what effects it has in their work. Questions that could be used in a public sector survey or interview include:- Have you consulted BO information in your work, and if so, how do you analyse it?
- Has using BO information helped you make decisions?
- To what extent has accessing information from the BO register helped you save time or resources?
- Are there clear procedures in place for identifying and acting on risks (e.g. of COIs or bid-rigging) using BO information?
- What types of risks have you identified using BO data?
- Private sector:
Ask businesses about their experience reporting and using BO information, and participating in public procurement. For example, if they feel the system is fair; if they are more willing to bid when they perceive transparency levels to be higher; and if they use BO information for processes like risk management. Behavioural tools such as willingness-to-pay models can also be used to quantify the value businesses assign to integrity improvements. Questions that could be used in a private-sector survey or interview include:- What is the maximum additional time (i.e. staff hours) you would accept to comply with BO reporting requirements and still participate in public procurement?
- If stronger BO disclosure requirements reduced the likelihood of competitors using anonymous companies (and increased perceived fairness), what is the maximum additional bid-prep cost you would accept?
- What is the value to your company of a single digital BO reporting requirement that is recognised across multiple authorities (per year)?
- Have you ever consulted information held in the BO register, and if so for what purpose?
- For foreign suppliers, how much additional cost would make you shift away from bidding in this market?
- Civil society and media:
Ask non-government actors like journalists about their ability to access and use BO and procurement information, and what effects it has in their work. Questions that could be used in a public sector survey or interview include:- From where and how do you normally access BO information, and in what formats?
- How do you use BO data as part of your work?
- Could you talk through a specific example of when you used BO information? What was the result?
- What types of insights have you gained from using BO information?
- Do you feel the BO register has had a deterrent effect (e.g. on COIs or bid-rigging) in public procurement?
Track B: Correlational and comparative analysis
Track B uses quantitative methods that draw on data, such as structured procurement and BO data, to spot changes and patterns linked to BO transparency reforms over time or across contexts. [26] It relies heavily on administrative data sources – such as procurement registers, BO declarations, COI databases, and supplier profiles – to assess whether changes in procurement outcomes are associated with BO transparency reforms.
Track B is most applicable in jurisdictions where BO and procurement data are systematically collected, standardised, and available over multiple years. It may make use of relatively simple methods to track trends over time, or more complex statistical methodologies to establish correlations and causal relationships, or to detect hidden patterns. As such, this guide signposts options and does not go into detail about methodology design.
The following are (non-comprehensive) examples of analytical approaches that could be used under Track B:
- Pre/post-comparison:
Compare procurement metrics before and after the BO transparency reform was implemented to understand what changed by recording the values of key indicators at different points in time.- Example research questions: Following the implementation of BO transparency reforms, did the percentage of single-bid tenders decrease? Did the rate of bidder disqualifications increase? Did fewer companies from high-risk jurisdictions participate in tenders?
- Approach: This approach relies on the availability of administrative or procurement datasets covering multiple time points – i.e. before and after the introduction or reform of a BO register. Primary data collection may be particularly useful to capture post-reform developments, but is not expected to be extensive. Rather, the focus is on making the most of what is already available within the jurisdiction.
- Cross-jurisdictional comparison:
Compare data on key indicators from multiple jurisdictions with different approaches to BO transparency implementation to observe similarities and differences.- Example research questions: Do jurisdictions with mandatory BO verification have a higher diversity of public sector suppliers? Is the exclusion rate of high-risk suppliers greater in countries with automated screening which uses BO information?
- Approach: Use comparative findings to assess the maturity and impact of different BO transparency design models and identify jurisdictions that serve as useful comparisons. This approach requires comparable data to be collected for more than one country or jurisdiction.
- Regression or event-based analysis:
Use advanced methods, such as econometric models or time-series analysis, to establish a causal relationship between BO reforms and procurement outcomes.- Example research questions: Is there an association between BO reforms and a change in market size, sector, and number of tenders? Which specific risk indicators are robust predictors of corruption in the jurisdiction (Box 4)?
- Approach: Estimating the contribution of BO transparency to changes in procurement outcomes – while controlling for factors such as other anti-corruption reforms – is the most ambitious approach. Research might focus on regression analysis of market size, sector, and number of tenders related to use of BO registers (e.g. greater supplier diversity, lower bid variance, more frequent red-flag alerts), or event study analysis comparing data before and after the enforcement of BO rules, for instance, using a difference-in-difference design (Box 2).
Track C: Framework mapping and policy alignment
While Tracks A and B focus on creating new evidence through surveys and data analysis, Track C ensures strategic alignment with international frameworks, making the evaluation outputs more useful for governments, donors, and global monitoring bodies. Track C emphasises the need to consider the following frameworks in particular:
- FATF Recommendations and evaluations (especially Immediate Outcome 5); [27]
- World Bank B-READY indicators on transparency, competition, and procurement quality; [28]
- United Nations (UN) Sustainable Development Goals (SDGs), notably SDG 16.5 and 16.6; [29]
- UN Convention Against Corruption (especially Resolution 10/6); [30] and
- Open Contracting Data Standard, Open Ownership Principles, Tax Justice Network Roadmap to Effective Beneficial Ownership Transparency, and other civil society frameworks. [31]
Practical implementation: Adaptation and scaling
This evaluation framework is designed to be an adaptive tool. It can be applied in various contexts, outlined below.
- Low-capacity settings:
If a jurisdiction has limited administrative data, or it has not yet initiated BO reforms, BO data use in procurement, or either, it could focus primarily on Track A and Track C. For example:- Research can use surveys and interviews to gather early insights and align implementation and data use plans with international standards.
- Countries in early reform stages can begin with pilot surveys focused on stakeholder trust (e.g. for improved competition and public accountability), or on the perceived usefulness of BO data in procurement oversight.
- Referring to international standards can help benchmark goals for reforms.
- Aspects of Track B are also selectively applicable, especially with partial procurement data. For example, jurisdictions without a BO register can analyse bidder participation, contract values, or supplier concentration. It may be helpful to compare these metrics to peer countries with BO transparency frameworks which share similar characteristics to highlight gaps and inefficiencies, motivating reform and demonstrating how BO transparency could help.
- Data collected at this stage can offer a useful baseline for pre- and post-comparison using qualitative approaches, quantitative approaches, or both.
- Medium-capacity settings:
If there is some administrative data following the implementation of BO transparency reforms, researchers can start using Track B, in addition to Tracks A and C, to see the initial effects of the reforms. For example:- Jurisdictions can create a baseline and start to compare metrics like bidder participation, contract values, or supplier concentration over time as BO information is introduced into procurement processes.
- Analysis can focus on identifying context-relevant red flags or shorter-term effects, such as the frequency of single-bid tenders or compliance with BO transparency requirements among bidders.
- Research can also apply case-based or event-based studies around major reform milestones, such as the launch of a public BO register.
- Finally, analysis in Track B can inform the questions asked in Track A, as interview and survey data provide qualitative evidence to understand the trends observed.
- High-capacity systems:
If there is well-structured, complete data that has been systematically collected for multiple years, researchers can use the full framework and more advanced statistical approaches in Track B. For example:- Detailed statistical analysis under Track B can offer a more comprehensive picture of impact across one or more use cases of BO information and explore marginal impacts of BO reforms.
- Research could look at the effects of the systematic use of red flags in procurement processes to detect and investigate COIs, and isolate the effects of BO reforms on the resulting savings or recovered assets for the government.
- Another option is cost-benefit analysis, comparing register maintenance spending with procurement savings (e.g. to understand due diligence cost reduction and institutional efficiency).
- Longitudinal tracking of impacts over time could include looking at shifts in supplier demographics and exclusion of high-risk offshore vehicles.
- As above, Tracks A and B are highly complementary, offering a more holistic picture of what impacts reforms are having and why.
It should be noted that even if initial results seem limited, it does not mean the reform has failed. Research may instead be highlighting areas that need improvement, such as weak enforcement or poor data usability. [32] These findings are crucial for strengthening the system and ensuring investment in policy reforms pay off. Moreover, results should be interpreted with reference to the policy context.
3. Focusing on risks and benefits
While BO information is not essential to detecting all red flags in public procurement, it can be used to respond to a range of procurement risks (see, for examples, Boxes 4 and 5). The resulting effects can be measured using the three-track framework presented above. For each of the following eleven risk areas, we connect a potential benefit of using BO information to the risk it addresses, and suggest a non-comprehensive description of means to measure the benefit; what data is needed to do so; and which of the three tracks would be suited to pursue research in this area. Boxes illustrating existing research show that multiple risks and benefits can be considered within a single research project.
In each case, indicators should be contextualised, complemented, and interpreted together with other relevant data, such as various factors in the policy context. Interpreting an isolated figure rarely offers an explanation as to the driver of the change; for instance, a drop in COI cases being flagged could be due to deterrence from greater transparency or bad actors finding new routes to conceal COIs. Qualitative and quantitative information can be complementary in diagnosing the causes of change, especially when there is limited administrative data to establish causality.
Box 4. Red flags in public procurement
The Open Contracting Partnership has produced a 2024 guide outlining a data-driven methodology for identifying and mitigating corruption risks in public procurement through the integration of open contracting and BO data. [33] It describes a structured approach to detecting red flags – patterns and indicators of potential corruption – by linking procurement data (from Open Contracting Data Standard sources) with BO registers that reveal the real individuals controlling bidding entities. The methodology includes: data collection, cleaning, and matching across these datasets; risk-indicator development and testing; and validation of findings through case studies and collaboration with anti-corruption bodies. It emphasises the importance of data interoperability, transparency, and capacity-building for public servants to act on identified risks. BO data is positioned as a crucial enhancement to conventional procurement transparency measures, enabling the identification of hidden relationships and COIs among suppliers and officials.
Box 5. Data-driven approaches to measuring procurement integrity and impact
The World Bank Governance Risk Assessment System (GRAS) exemplifies a data-driven methodology for measuring procurement integrity and impact by systematically identifying risks of fraud, corruption, and collusion across public spending. [34] Rather than relying on ex post investigations or individual complaints, GRAS uses large volumes of administrative and procurement data to generate standardised red flags that proxy underlying risk patterns. A central component of this approach is the integration of firm-level and ownership-related data – drawn from business registers, shareholder records, and linked administrative datasets – which enables the system to move beyond the legal entities to examine who ultimately owns, controls, or benefits from government suppliers. These ownership and control signals are particularly important for detecting risks associated with supplier characteristics and political connections, such as shell companies, nominees, or hidden COIs. As with other GRAS indicators, ownership-related red flags are probabilistic rather than determinative, and gain analytical strength through triangulation with procurement-cycle and collusion indicators.
From an impact measurement perspective, GRAS illustrates how procurement reforms can be assessed through changes in exposure to integrity risks, including those linked to opaque or high-risk ownership structures. By systematically incorporating relevant information (for example, shareholder identities, links to PEPs, or registration in secrecy jurisdictions), the methodology enables more precise monitoring of whether reforms reduce the participation and success of risky suppliers over time. This allows evaluators to track not only shifts in competition and pricing outcomes, but also changes in who wins public contracts and under what ownership conditions. Evidence from pilot implementations shows how combining procurement data with information about company ownership and PEPs can identify large numbers of high-risk suppliers and contracts; support targeted enforcement and preventive vetting; and provide a robust basis for measuring the governance impact of transparency and integrity reforms.
1. Detection and prevention of conflicts of interest
- What is the risk:
An official involved in a procurement decision has personal interests that clash with their professional ability to award a contract to a bidding company according to the procurement regulations.
- How BO transparency helps:
BO data reveals the people behind companies, making it possible to cross-check against records of public officials and their associates. It can also be used to detect patterns pointing to COIs being intentionally hidden through the use of nominees.
- Data needed:
- BO information (on a per record basis or in bulk);
- civil servant asset declarations;
- procurement data including information about awardees and bidders, and procurement processes (e.g. number of bids submitted, publication and deadline dates); and
- information on PEP status or involvement in procurement processes.
- Challenges to effective data use:
- lack of interoperability across data systems;
- legal constraints on data sharing; and
- lack of centralised and consistent information about PEPs.
- Evaluation approaches:
- Expert estimation surveys or interviews on register usage and effectiveness (Track A).
- Cross-checking BO registers with public officeholder declarations, or the development and application of quantitative models to predict robust red flags for COI prevention based on historical procurement data (Track B).
- What to measure:
- number of flagged or confirmed COI cases;
- whether enforcement actions are taken;
- disqualifications due to BO conflicts;
- user feedback on register tools; and
- change in the proportion of single-bid contracts.
Box 6. Using beneficial ownership information for large-scale risk flagging
A 2024 paper using data from six European countries tested whether BO data can help detect corruption risks in public procurement using a two-step method. [35] First, it developed a set of simple BO red flags based on how corrupt actors might try to hide, such as one person owning many companies; frequent ownership changes; missing or foreign ownership information; or links to PEPs. Second, it checked whether these red flags were actually linked to high-risk procurement outcomes by running country-by-country statistical tests. These tests compared the presence of each red flag with an existing corruption risk index for contracts, while controlling for basic factors like contract size, year, and buyer type. The approach used straightforward data matching between procurement records and BO registers, and treated unusual patterns (e.g. sudden spikes) as signals worth noting. The research determined that red flags vary by country context, and identified which red flags were relevant for each country in the sample. It provides a replicable way to measure whether better BO transparency makes it easier to spot corruption risks in procurement, and to identify context-specific red flags for use in real-time procurement processes.
2. Mitigation of fraud and collusion
- What is the risk:
Companies agreeing to rig bids or manipulate prices instead of competing fairly.
- How BO transparency helps:
BO data can be used to identify companies that are owned or controlled by the same people, even if they do not appear so at face value, such as on the basis of their legal owners.
- Data needed:
- BO information (on a per record basis or in bulk);
- procurement bid records; and
- company register data, including legal ownership over time.
- Challenges to effective data use:
- hidden nominee structures;
- incomplete disclosures; and
- legal vehicles registered in secrecy jurisdictions.
- Evaluation approaches:
- Survey or interviews of procurement and competition agencies about use of BO information (Track A).
- Cross-analysis of BO register and procurement bid data for shared ownership detection or to capture deterrence effects (Track B).
- What to measure:
- the number of tenders involving firms with the same beneficial owners (considering direct and indirect ownership links);
- the number of identified collusion cases;
- whether enforcement actions are taken; and
- the use of red flags involving BO information in bid monitoring.
Box 7. Detecting collusion risk in public procurement
A 2016 paper documented how Slovakia’s BO register was used as a tool to detect potential collusion in public procurement by revealing when the same individuals were the beneficial owners behind multiple companies bidding for or winning government contracts. [36] An analysis of procurement and BO information showed clusters of companies controlled by the same beneficial owner operating within the same industry and competing for similar tenders – a potential indicator of an increased risk for collusion. The analysis showed that several beneficial owners were linked to dozens of companies active in procurement, particularly in sectors such as construction and waste management. The information made it possible to uncover hidden relationships that were not visible through basic company information, enabling civil society and oversight bodies to identify red flags and call for investigations into potentially anti-competitive behaviour.
3. Improved competition and market access
- What is the risk:
Fair competition is essential for getting the best value for money for procuring entities, and firms may avoid the procurement market due to perceived unfairness where transparency is lacking.
- How BO transparency helps:
When companies believe that the system is fair and free from hidden deals, they are more likely to participate, and when governments can assess and mitigate risks with more confidence, they can procure from suppliers that may be seen as riskier (e.g. younger companies and small and medium-sized enterprises (SMEs)).
- Data needed:
- BO information (in bulk and in a structured format);
- procurement data about awardees, bidders, and characteristics of procurement processes (e.g. estimated price of tender, bidding prices, number of excluded bids); and
- supplier demographics (e.g. supplier identity, frequency of participation, market share, geographic distribution, and sectoral focus).
- Evaluation approaches:
- Surveys of supplier confidence, especially among SMEs (Track A).
- Analysis of bidder data pre and post-BO transparency reforms to observe a change in the number of bidders per tender or market concentration indices (Track B).
- What to measure:
- change in number of unique suppliers;
- change in Herfindahl-Hirschman Index (HHI); [37]
- change in the average number of bidders;
- Open Contracting market opportunity metrics; [38]
- change in the number of new registered suppliers; and
- change in the number of unique bidders.
- Challenges:
- Difficult to isolate the effect of BO transparency from other reforms.
Box 8. Beneficial ownership disclosure mitigates potential conflicts of interest and improves competition
A 2024 paper examined whether requiring firms to disclose their beneficial owners affects fairness and competition in public procurement. [39] It uses a difference-in-differences design to look at the staggered rollout of BO registers across EU countries. First, the author constructs a detailed dataset of over 250,000 procurement contracts (from 2015–2019); measures competition at the country–product–quarter level, using HHI and the number of unique winning firms; and identifies the introduction dates of BO registers as treatment events. The analysis then tests mechanisms by linking government-contract data to ownership data (from the UK, Denmark, and Slovakia) to flag politically connected or repeat beneficial owners. Finally, further tests segment countries by ownership transparency, public scrutiny, and regulatory capacity. The findings show that after registers were introduced, competition increased significantly (lower market concentration and more unique winning firms); politically connected or high-risk owners received fewer contracts; new entrants were more likely to be smaller and local firms; and contracts were less likely to be modified ex post, indicating improved performance. Overall, the study concludes that BO transparency reduces COIs, enhances accountability, and improves procurement outcomes.
4. Enhanced monitoring and public accountability
- What is the risk:
Opacity and abuse in public spending may go unchecked where journalists, civil society, and the broader public are not empowered to act as independent watchdogs.
- How BO transparency helps:
BO data that is made widely available can be combined with procurement data to spot red flags, hold officials accountable, and generate investigative reporting that enhances public scrutiny. [40]
- Data needed:
- BO information made widely or publicly accessible;
- procurement data about awardees, bidders, and characteristics of procurement processes (e.g. number of bids, procurement methods used);
- information from a supplier register; and
- media and open intelligence sources.
- Challenges to effective data use:
- data literacy;
- legal access restrictions in some jurisdictions; and
- limited institutional response.
- Evaluation approaches:
- Survey or interviews of civil society, journalists, and watchdogs (Track A).
- Frequency of BO cited in investigations or media reports (Track B).
- What to measure:
- the number of civil society reports and media investigations using or referencing BO information;
- policy reforms, formal investigations, or prosecutions following media investigations;
- citizen complaints; and
- cases of public identification of formerly undetected nominees, nominee owners, or beneficial owners with political connections.
5. Verification of eligibility for preferential procurement
- What is the risk:
Governments may set specific additional eligibility criteria for certain contracts, including requiring suppliers to be domestically or women-owned, or SMEs, and these requirements can be circumvented or abused by those who are not eligible.
- How BO transparency helps:
BO data can help verify that a supplier matches the eligibility criteria, detecting and deterring the use of front companies to feign eligibility.
- Data needed:
- BO information (on a per record basis or in bulk);
- information on beneficial ownership networks, including legal ownership and intermediaries;
- preferential scheme records; and
- firm self-declarations of eligibility or third-party certification.
- Challenges to effective data use:
- data integration and real-time verification; and
- eligibility criteria, which must be clearly defined in ownership terms.
- Evaluation approaches:
- Case audits of firms awarded under preferential schemes (Track B).
- Analysis of administrative data when verification or self-declaration is at the point of registration, or when procurement data is tagged to indicate a tender is reserved (Track B).
- What to measure:
- the number of verified claims of eligibility (e.g. certification);
- the number of disqualified claims of eligibility; and
- the number of verified preferential contracts.
6. Reduction in due diligence costs
- What is the risk:
The time and money it takes for procurement officials to vet potential suppliers may be large.
- How BO transparency helps:
A centralised and reliable BO register saves time by providing a single source for background checks. Cost reduction can be a quick-win in early implementation contexts.
- Data needed:
- records of BO data access;
- feedback from procurement officials;
- information about exclusion criteria; and
- information about vetting procedures.
- Challenges to effective data use:
- lack of understanding of the usefulness of BO information; and
- lack of formal vetting requirements.
- Evaluation approaches:
- Surveys of procurement officers (Track A).
- Administrative data on vetting timelines and cost benchmarks (Track B).
- What to measure:
- average time for supplier screening and background checks;
- reported use of BO data by procurement officials;
- share of vetting done using BO information from a central register; and
- use of automated screening systems and cost implications.
7. Exclusion of high-risk and noncompliant entities
- What is the risk:
Sanctioned or debarred companies may try to win government contracts by forming a new company or using a related company to bid.
- How BO transparency helps:
Officials can match BO data against sanctions lists or debarment lists to automatically flag high-risk suppliers.
- Data needed:
- BO information (on a per record basis or in bulk);
- sanctions lists;
- debarment lists;
- administrative data on flagged suppliers; and
- procurement data about awardees and bidders.
- Challenges to effective data use:
- lack of up-to-date or centralised debarment or sanctions lists; and
- data exchange between agencies.
- Evaluation approaches:
- Matching BO data with sanctions lists or debarment lists (Track B).
- Use of risk-scoring models (Track B).
- What to measure:
- the number of high-risk suppliers flagged or excluded based on BO data; and
- volume of tenders involving high-risk suppliers.
Box 9. Using beneficial ownership information to increase revenue during the award of mining licences
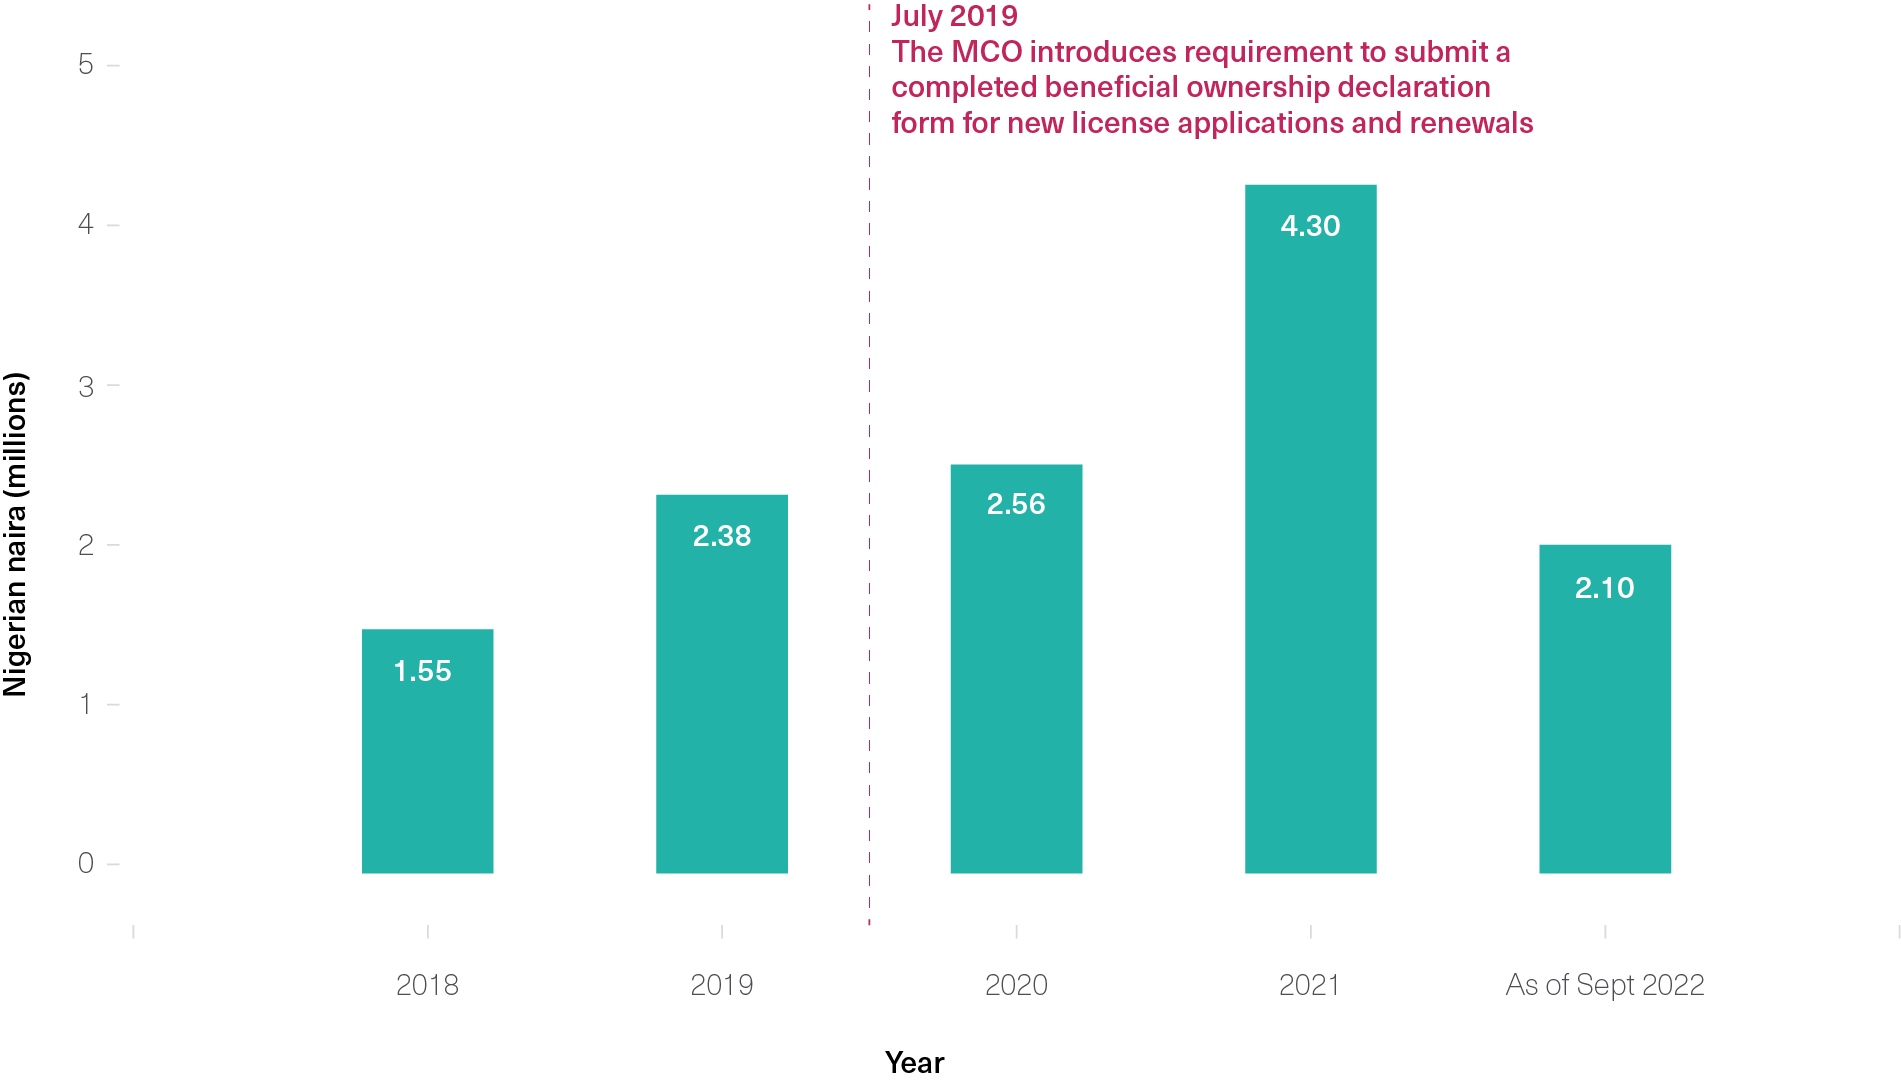
A 2022 report documented that Nigeria’s Mining Cadastre Office (MCO) required the submission of a BO declaration as a precondition for new licence applications and renewals starting in July 2019, which significantly improved the regulation of licensing and revenue mobilisation. [41] This system helped identify mineral title holders with outstanding debts who attempted to reapply with new companies, compelling them to clear their debts or have their application rejected. From 2019 to 2021, 15,483 applications were rejected and 4,997 revoked, leading to a substantial increase in revenue – reaching NGN 4.3 billion (approximately USD 9.8 million) in 2021, more than doubling the level of revenue in 2018. The MCO also emphasised the importance of data sharing and cooperation with other government efforts, aligning with the Nigeria Extractive Industries Transparency Initiative Beneficial Ownership Portal and the Corporate Affairs Commission, and collaborating with investigative bodies to combat corruption. While not public procurement, there are overlaps in how agencies regulating natural resource extraction and those managing public spending can use BO information for impact.
Figure 2. MCO revenue generation (2018 – September, 2022) [42]
8. Cross-border procurement overreach and cooperation
- What is the risk:
Identifying the beneficial owners of suppliers may become more difficult in cross-border contracts involving companies from multiple jurisdictions.
- How BO transparency helps:
Using international standards for data collection and exchanging information makes it easier to trace ownership of foreign companies.
- Data needed:
- Well-structured BO information in bulk;
- cross-jurisdiction procurement data (ideally standardised); [43] and
- administrative data on matches, alerts, and data use.
- Challenges to effective data use:
- legal and technical harmonisation;
- language and jurisdictional barriers; and
- data exchange.
- Evaluation approaches:
- Administrative metadata on cross-border procurement reviews (Track B).
- Comparative case studies (Track C).
- What to measure:
- the number of cross-border matches or alerts; and
- the use of cross-border BO data in audits of suppliers.
9. Institutional innovation and regulatory culture
- What is the risk:
BO transparency reforms may not lead to effective data use, broader improvements in public administration, or a shift toward a more data-driven culture.
- How BO transparency helps:
Implementing a digital BO register can drive innovations like the creation of new risk-scoring tools, automated red-flag systems, and performance benchmarks for officials.
- Challenges:
- lack of mandate or guidance for procurement officials; and
- lack of understanding of BO information.
- Evaluation approaches:
- Interviews with procurement agency representatives (Track A).
- Administrative indicators on things like BO data usage, training modules created, and procedural reforms (Track B).
- What to measure:
- internal agency reports and user feedback;
- the number of new tools or systems using BO information;
- the number of staff trained to use BO data; and
- changes in data use resulting from procedural reforms.
10. Minimising the participation of anonymous companies from secrecy jurisdictions
- What is the risk:
Companies from jurisdictions that do not collect or share comprehensive information about company ownership may be used to hide beneficial ownership for reasons such as to avoid detection of COIs or collusion.
- How BO transparency helps:
Laws can require disclosure of beneficial owners for foreign as well as domestic firms, making it difficult for high-risk companies or beneficial owners to hide.
- Data needed:
- BO information;
- procurement data on bidders and awardees; and
- supplier register data.
- Challenges to effective data use:
- BO disclosure requirements limited to domestic companies.
- Evaluation approaches:
- Survey perceptions of opacity risks among non-domestic firms (Track A).
- Perform trends or regression analysis of suppliers from secrecy jurisdictions and behaviour changes over time (Track B).
- What to measure:
- the number of companies registered in secrecy jurisdictions participating in tenders;
- the number of companies registered in secrecy jurisdictions winning bids;
- the total value of contracts awarded to these companies; and
- BO disclosure compliance among foreign firms.
Box 10. Beneficial ownership transparency and cross-border investment
A 2023 paper evaluated whether requiring companies to disclose their beneficial owners affected cross-border investment flows into the EU. [44] The authors used the EU’s staggered introduction of BO registers as a natural experiment, first analysing official foreign direct investment data to compare investment into EU countries before and after transparency rules took effect, then examining mergers and acquisitions to trace the behaviour of individual investors. They distinguished between investments routed through financial havens and those from non-haven countries, and between registers that were only available to authorities and those made publicly accessible.
The study found that BO transparency significantly reduced investment coming from offshore financial centres, especially when ownership data was publicly available, while investment from other countries was unaffected or had even increased. Evidence from merger and acquisition data showed that the decline was largely driven by EU investors who had been reinvesting via offshore entities (“round-tripping”), indicating that transparency reduced the attractiveness of secrecy-based investment structures. Overall, the paper concluded that public BO registers for legal vehicles deterred opaque capital flows through havens without harming legitimate foreign investment, supporting transparency as an effective policy tool.
11. Detection of undue influence in procurement decision-making
- What is the risk:
Political donations by bidding firms or their beneficial owners can create pressure or expectations that distort tender design, evaluation, or award decisions to their favour, especially where contracting authorities are more politicised (e.g. line ministries) or oversight is weak. [45]
- How BO transparency helps:
Linking bidders to their real owners allows matching those individuals and controlling interests to political donation records, party finance reports, and lobbying registers, revealing hidden ties between donors and awardees that are obscured when ownership is routed through subsidiaries or nominees.
- Data needed:
- BO records for bidding and winning firms, with historical snapshots to capture ownership at the time of tender;
- standardised procurement data on tenders, bids, awards, procedures, competition, and modifications, with buyer identifiers and sector codes;
- political finance data: firm-level and owner-level donations to parties and candidates, election cycles, donation dates/amounts; lobbying registers where applicable; and
- context data: agency independence/politicisation markers; electoral timelines; sanctions and PEP lists to triangulate high‑risk ties.
- Challenges to effective data use:
- fragmented or inaccessible political finance records; donations made via associates or foundations that weaken direct matching to beneficial owners; and
- legal and ethical limits on using political activity data in procurement decisions; risk of false positives without careful controls for capability, reputation, and past performance.
- Evaluation approaches:
- Interviews or surveys on whether there are checks for links between the beneficial owners of companies and political donation, how often these checks lead to extra scrutiny, and whether perceived pressure from political appointees changes when such links are visible (Track A).
- Pre, post, or event‑study tests around donation cycles or major reforms; linking BO data to donation databases to see if donors or donor‑linked owners win more often, face fewer competitors, or receive more contract modifications in periods when their aligned party holds power, controlling for sector and agency features (Track B).
- What to measure:
- the share and value of awards to firms whose beneficial owners made donations to the awarding authority’s governing party in the relevant electoral cycle, by agency and sector;
- competition indicators on those awards (number of single-bid awards, average number of bidders) and award method (use of non-competitive or restricted procedures); and
- time from tender to award, frequency and size of ex‑post modifications for donor‑linked awards versus others.
Footnotes
[16] Angus Barry, “Exploring patterns of beneficial ownership reform”, Open Ownership, 8 February 2024, https://www.openownership.org/en/blog/exploring-patterns-of-beneficial-ownership-reform/.
[17] OECD, Government at a Glance 2025 (OECD, 2025), https://www.oecd.org/en/publications/government-at-a-glance-2025_0efd0bcd-en/full-report/levels-of-trust-in-public-institutions_62a3b94e.html; World Bank Group, “Worldwide Governance Indicators”, 2025, https://www.worldbank.org/en/publication/worldwide-governance-indicators.
[18] Transparency International, “Corruption Perceptions Index”, n.d., https://www.transparency.org/en/cpi/.
[19] World Justice Project, “The Global Rule of Law Recession is Accelerating”, 2025, https://worldjusticeproject.org/rule-of-law-index/.
[20] V-Dem, “Varieties of Democracy (V-Dem)”, home page, n.d., https://www.v-dem.net/.
[21] OECD, Conflict of Interest Policies and Practices in Nine EU Member States: A Comparative Review (OECD, 2005), https://doi.org/10.1787/5kml60r7g5zq-en.
[22] OECD, Anti-Corruption and Integrity Outlook 2024 (OECD, 2024), https://www.oecd.org/en/publications/anti-corruption-and-integrity-outlook-2024_968587cd-en.html.
[23] World Trade Organization, “Agreement on Government Procurement”, n.d., https://www.wto.org/english/tratop_e/gproc_e/gp_gpa_e.htm.
[24] World Trade Organization, GPA, Article IV, paragraphs 1 and 2.
[25] World Trade Organization, GPA, Article IV, paragraph 4(b).
[26] Open Contracting Partnership, “Open Contracting Data Standard – Beneficial ownership information”, n.d., https://standard.open-contracting.org/latest/en/guidance/map/beneficial_ownership/#beneficial-ownership-information.
[27] FATF, The 2022 and 2013 Methodologies for Assessing Technical Compliance with the FATF Recommendations and the Effectiveness of AML/CFT/CPF Systems (FATF, updated 2025), https://www.fatf-gafi.org/content/fatf-gafi/en/publications/Mutualevaluations/Fatf-methodology.html.
[28] World Bank, “B-READY”, n.d., https://www.worldbank.org/en/businessready.
[29] UN Department of Economic and Social Affairs, “Sustainable Development Goal 16: Promote peaceful and inclusive societies for sustainable development, provide access to justice for all and build effective, accountable and inclusive institutions at all levels”, n.d., https://sdgs.un.org/goals/goal16#targets_and_indicators.
[30] UN Office of Drugs and Crime Corruption and Economic Crime Branch, “Learn about UNCAC”, n.d., https://www.unodc.org/corruption/en/uncac/learn-about-uncac.html.
[31] Open Contracting Partnership, “Open Contracting Data Standard”, n.d., https://standard.open-contracting.org/latest/en/; Open Ownership, Principles for effective beneficial ownership disclosure (Open Ownership, updated 2023), https://www.openownership.org/en/principles/; Andres Knobel, “Roadmap to Effective Beneficial Ownership Transparency (REBOT)”, Tax Justice Network, 7 February 2023, https://taxjustice.net/2023/02/07/roadmap-to-effective-beneficial-ownership-transparency-rebot/.
[32] Open Ownership, Usable beneficial ownership data (Open Ownership, 2025), https://www.openownership.org/en/publications/usable-beneficial-ownership-data/.
[33] Camila Salazar, Red Flags in Public Procurement: A guide to using data to detect and mitigate risks (Open Contracting Partnership, 2024), https://www.open-contracting.org/resources/red-flags-in-public-procurement-a-guide-to-using-data-to-detect-and-mitigate-risks/.
[34] World Bank, Governance Risk Assessment System (GRAS): Advanced Data Analytics for Detecting Fraud, Corruption, and Collusion in Public Expenditures (World Bank, 2023), https://openknowledge.worldbank.org/entities/publication/841d9990-8f7e-4860-9acd-cba1b9f096a3.
[35] Irene Tello Arista, Mihály Fazekas, and Antonina Volkotrub, Using beneficial ownership data for large-scale risk assessment in public procurement: The example of 6 European countries (Government Transparency Institute, 2024), https://www.govtransparency.eu/wp-content/uploads/2024/07/Arista-Fazekas-Volkotrub_BO-CRI_GTI_WP_2024.pdf.
[36] Juraj Labant and Gabriel Šípoš, The Register of Beneficial Ownership in Slovakia: Revolutionary transparency, questionable implementation, unsure benefits (Transparency International Slovakia, 2017), https://transparency.sk/sk/the-register-of-beneficial-ownership-in-slovakia-revolutionary-transparency-questionable-implementation-unsure-benefits/.
[37] The HHI is a measure competition based on the size of firms in relation to their industry. See: Eurostat, “Statistics Explained – Glossary:Herfindahl Hirschman Index (HHI)”, n.d., https://ec.europa.eu/eurostat/statistics-explained/index.php?title=Glossary:Herfindahl_Hirschman_Index_(HHI).
[38] Open Contracting Partnership, “Use case guide: Indicators linked to OCDS #public”, Google sheets, updated 2021, https://docs.google.com/spreadsheets/d/1j-Y0ktZiOyhZzi-2GSabBCnzx6fF5lv8h1KYwi_Q9GM/edit?gid=1075539355#gid=1075539355.
[39] Carol Seregni, “Who are you Doing Business with? Beneficial Ownership Disclosure and Public Procurement”, The Wharton School Research Paper (2024), https://papers.ssrn.com/sol3/papers.cfm?abstract_id=4826537.
[40] Mayya Konovalova, Penelope Tuck, and Rodrigo Ormeño Pérez, “In search of the owner: Regulating through transparency”, Critical Perspectives on Accounting 91 (2022), https://doi.org/10.1016/j.cpa.2022.102421.
[41] Alanna Markle and Tymon Kiepe, Who benefits? How company ownership data is used to detect and prevent corruption (Open Ownership, 2022), https://www.openownership.org/en/publications/who-benefits-how-company-ownership-data-is-used-to-detect-and-prevent-corruption/.
[42] Source: Markle and Kiepe, Who benefits?, 20.
[43] Open Contracting Partnership, “Open Contracting Data Standard”.
[44] Harald J. Amberger, Jaron H. Wilde, and Yuchen Wu, “Ownership Transparency and Cross-Border Investment”, Journal of Accounting and Economics 80, 2-3 (2025), https://doi.org/10.1016/j.jacceco.2025.101809.
[45] István János Tóth and Mihály Fazekas, New ways to measure institutionalised grand corruption in public procurement (U4 Anti-Corruption Resource Centre, 2014), https://www.u4.no/publications/new-ways-to-measure-institutionalised-grand-corruption-in-public-procurement.