Beneficial Ownership Visualisation System
Charts
Charts are an Optional Feature of BOVS Diagrams. It allows you to add a chart directly into the diagram which summarises the Beneficial Owners of a given Entity.
If you find that you want to draw more than a couple Indirect Lines leading to a given Entity, you are probably better summarising that information with a Chart. Instead of drawing Indirect Lines, the Chart has a bar for each Beneficial Owner whose interest you want to summarise.
Appearance
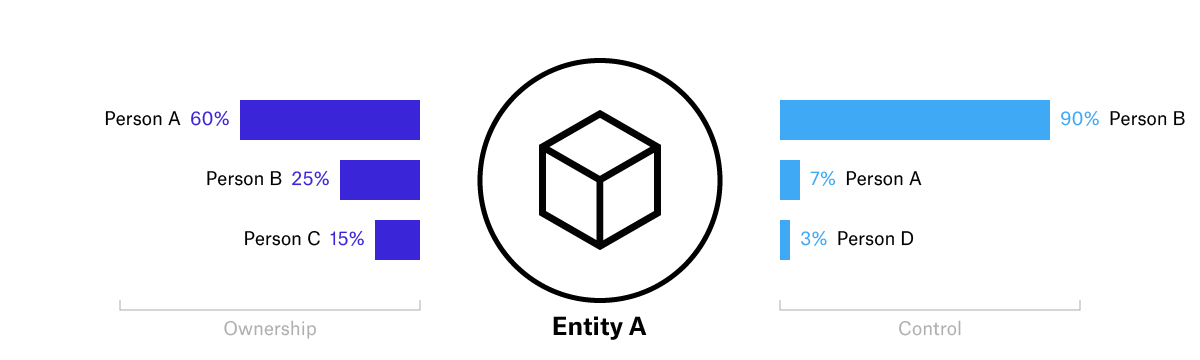
Charts are shown as bar charts attached to the Node of the given Entity.
- The chart shows a breakdown of either the Beneficial Owners with ownership interest or those with control interest.
- The chart appears on the appropriate side of the Node according to the Chirality rule.
- Nodes may have 2 charts; one each for its ownership and control breakdown.
Each chart should include one bar for each Beneficial Owner (considering the relevant type of interest).
- The Beneficial Owners may be different, or in a different order, between ownership and control charts.
- Label each bar with its value (percentage) and the Beneficial Owner it relates to.
- The Beneficial Owner should be identified using the same Label that appears beneath that Beneficial Owner’s Node.
- The bar label should appear on the outside end of the bar.
- Colour the bar according to the Colour rules (if you are using them).
- Attempt to sort bars by the strength of interest, using a consistent sorting direction across your diagram.
The chart must have a scale.
- The scale runs from 0% at the closest point to the Node, to 100% at the further point.
- Label the scale either Ownership or Control as appropriate.
The chart must be complete (otherwise it will be misleadingly oversimplified).
- All Beneficial Owners present in the main diagram should have representation within the Chart.
- If this leads to a Chart with too many bars, you can group multiple Beneficial Owners into a single bar (see below).
- In practice, it is likely you will want to show a separate bar for each Beneficial Owner that you consider relevant, and then one further grouped bar for all other Beneficial Owners.
Bar Grouping
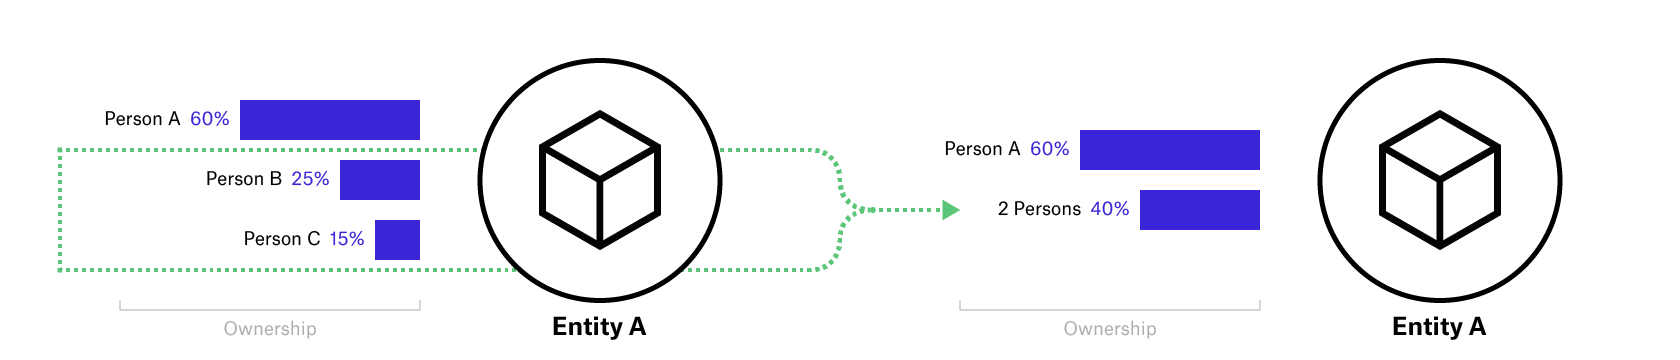
You may choose to combine several bars into one.
- The value of the grouped bar is the compounded and then combined interest of the Beneficial Owners that are grouped.
- Label grouped bars with the number and type of Parties grouped, e.g.
- 3 Persons
- 2 Unknown Entities
- 6 Parties (if Parties of more than one type are grouped)
- 3 or more Unknown Parties
Obscured Interests
The rules below describe how to handle obscured interests in bar charts.
Unknown Interests
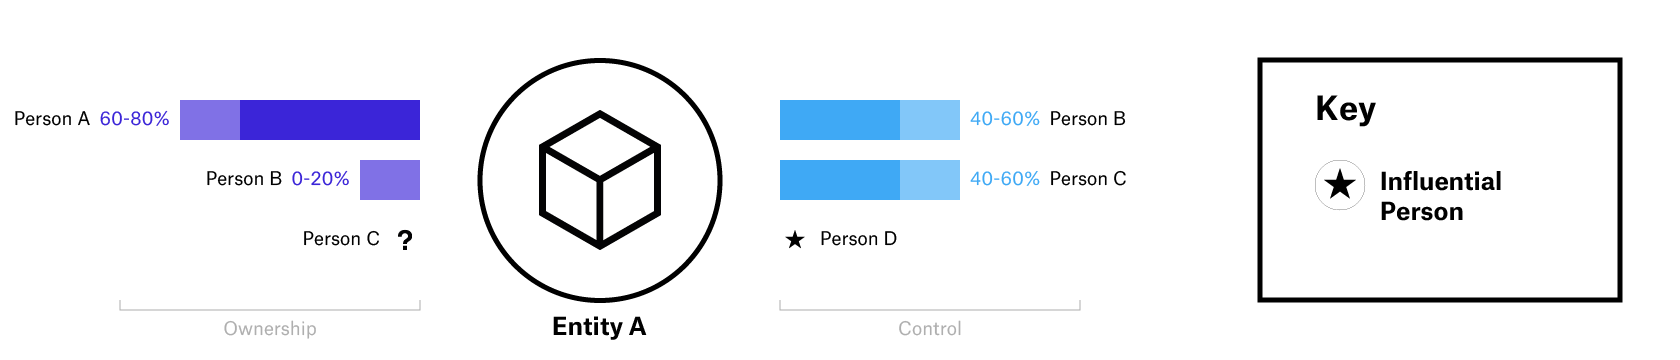
If it is not known whether a Beneficial Owner has an interest (Person C’s ownership, in the example above):
- Do not show a bar.
- Instead, show a question mark.
Uncertain Interests
Uncertain ranges are indicated by a semi-shaded region of the bar. For instance:
- If ownership is between 60-80%, draw a bar 60% fully-shaded and 20% semi-shaded (Person A’s ownership, in the example above).
- If ownership is 0-20%, draw a 20% bar that is only semi-shaded (Person B’s ownership, in the example above).
“Semi-shading” can be any style that is less prominent than the regular colouring for the bar.
Unquantifiable Interests
Where an interest has an unquantifiable element (Person D in the example above):
- Show an icon representing this unquantifiable property.
- The icon should appear just before the label.
- Use a different icon for each type of unquantifiable interest in your diagram.
- Include a key in your diagram offering information about each type of unquantifiable interest.